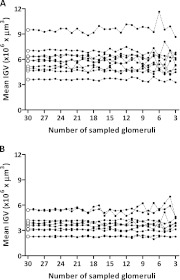
Fig. 2.
The effect of reduced glomerular sampling (through Jackknife simulation) on mean IGV values. Each dot represents one mean IGV value; dots united by a non-continuous line correspond to one subject. (A) (African Americans, n = 10 subjects) and (B) (Caucasian Americans; n = 10 subjects) represent the variation between mean IGV generated with 30 sampled glomeruli (open circles at the beginning of each horizontal line) and Jackknife generated values (black dots; from 29 to 3 sampled glomeruli per subject).

