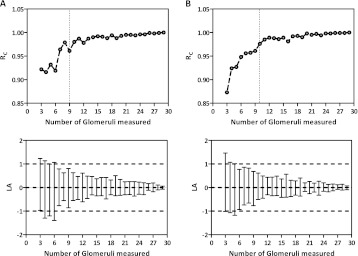
Fig. 3.
Lin’s concordance coefficient (RC) and its respective limits of agreement (LA, 95% CI) for different mean IGV values generated by the Jackknife in African Americans (Column A, n = 41) and Caucasian Americans (Column B, n = 34). The horizontal lines (----) illustrate 2 SD or ±1 × 106 μm3 and the vertical Lines (----) show the perfect agreement for RC.

