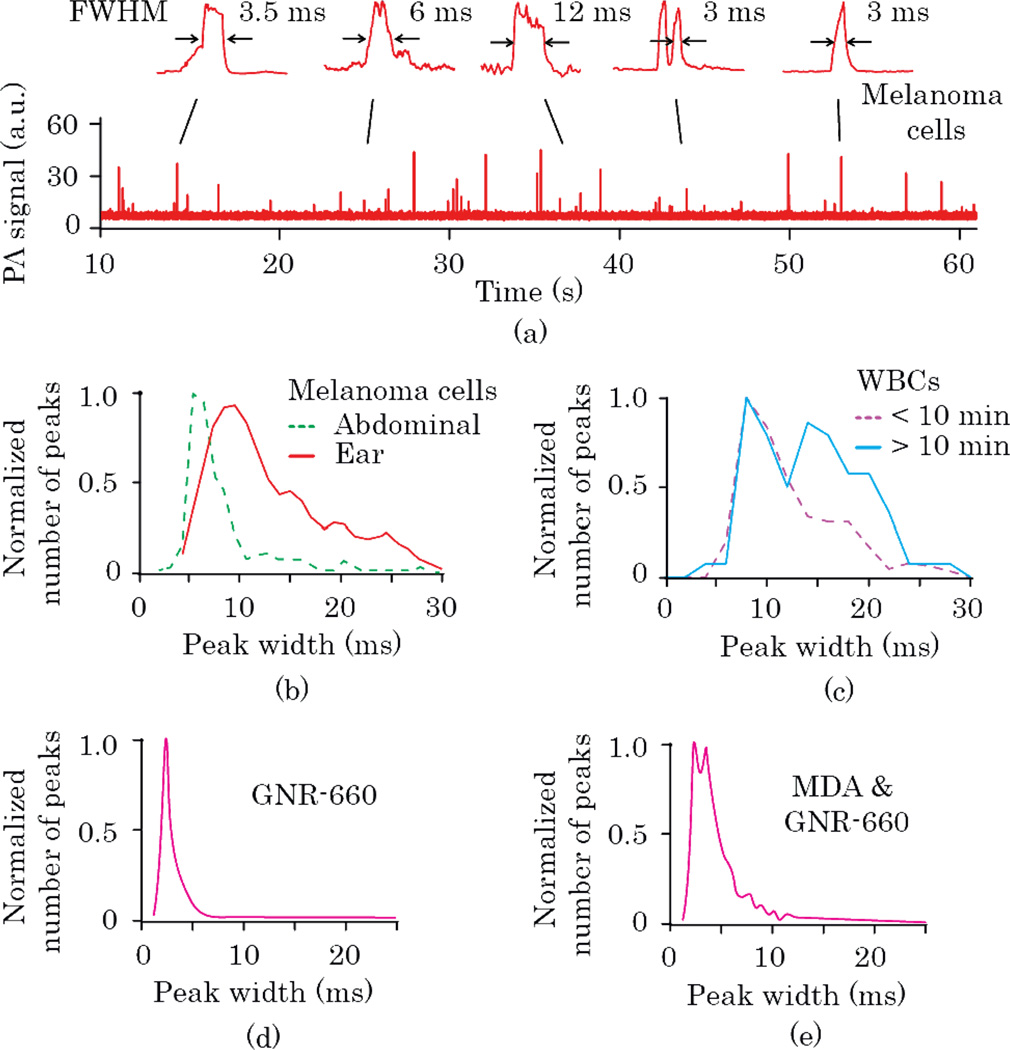
Fig. 3.
(Color online) In vivo time-of-flight PAFC. (a) Typical PA signal trace and peak shapes for B16F10 cells, in mouse ear vessel (1064-nm laser). Peak width distributions for (b) B16F10 cells in abdominal wall and ear blood vessels (1064 nm), (c) different time frames after i.v. injection of GNR-820-CD-45 for targeting WBCs in mouse circulation (820 nm), (d) i.v. injection of GNR-660-folate (671 nm), and (e) i.v. injection of MDA-MB-231 breast cancer cells labeled in vitro by GNR-660-folate (671 nm).

