Abstract
Sonoporation uses ultrasound, with the aid of ultrasound contrast agents (UCAs), to enhance cell permeabilization, thereby allowing delivery of therapeutic compounds noninvasively into specific target cells. The objective of this study was to determine if a computational model describing shear stress on a cell membrane due to microstreaming would successfully reflect sonoporation activity with respect to the peak rarefactional pressure. The theoretical models were compared to the sonoporation results from Chinese hamster ovary cells using Definity® at 0.9, 3.15, and 5.6 MHz and were found to accurately describe the maximum sonoporation activity, the pressure where a decrease in sonoporation activity occurs, and relative differences between maximum activity and the activity after that decrease. Therefore, the model supports the experimental findings that shear stress on cell membranes secondary to oscillating UCAs results in sonoporation.
INTRODUCTION
Sonoporation uses ultrasound (US), with the aid of ultrasound contrast agents (UCAs), to enhance cell permeabilization, thereby allowing delivery of therapeutic compounds noninvasively into specific target cells. The literature suggests that sonoporation is caused by the oscillation of UCAs.1, 2, 3, 4 Two potential physical mechanisms exist for sonoporation as a result of an oscillating UCA: Microstreaming and liquid jets. The literature suggests that liquid jets are the least likely mechanism due to the sporadic nature of liquid jet formation.2, 4, 5, 6 Therefore, microstreaming is theorized to be the major mechanism for sonoporation. Microstreaming occurring near a cell can result in shearing motions on the cell membrane, with the potential to cause a biological effect, such as sonoporation.
The studies performed in our laboratory showed a consistent sonoporation response versus peak rarefactional pressure (Pr) for varied UCAs and center frequencies.1, 2, 3 Under our experimental conditions, sonoporation activity (SA) was low at low Pr. As Pr increased, SA increased to a maximum. For some applied frequencies, the maximum SA extended into a plateau as Pr was increased. In all cases, increasing Pr further resulted in a sudden, significant drop in sonoporation. Higher Pr levels, above the inertial cavitation (IC) threshold, resulted in minimal sonoporation activity. The objective of the theoretical development herein is to determine if a model that describes microstreaming-induced shear stress on a cell can describe these sonoporation results.
This shear stress-microstreaming theoretical model was developed by combining several models already in existence. The oscillating UCA was described by the Marmottant model7 for an UCA located in a sound field. The resulting acoustic streaming velocity gradient near the surface of a bubble was described by Nyborg.8 Finally, particulars of the sonoporation study, including properties of the medium, exposure duration, and exposure pressures were incorporated into this model. To verify the ability of the shear stress-microstreaming model to predict sonoporation, the results from the model were compared to the experimental results of the SA versus Pr experiments at a variety of exposure conditions.
MODELING AN OSCILLATING ULTRASOUND CONTRAST AGENT
The first step in the creation of the shear stress-microstreaming model is to describe the oscillating behavior of an UCA in an ultrasonic field. The Marmottant model for bubble dynamics was chosen because this model incorporates the change in surface tension as the bubble oscillates, in addition to the inclusion of the extra damping due to the presence of the shell and restoring force of the shell.7 The Marmottant model for bubble dynamics is
| (1) |
where R is the time-dependent bubble radius, R0 is the equilibrium radius of the bubble, ρL is the density of the medium, P0 is the ambient pressure, σ(R) is the effective surface tension, κ is the polytropic gas exponent, κs is the shell surface viscosity, c is the speed of sound in the medium, μ is the viscosity of the medium, and pac(t) is the acoustic pressure. The surface tension, σ(R) is expressed in terms of the bubble radius,
| (2) |
where χ is the elastic modulus of the elastic regime of the bubble, Rbuckling is the radius below which the surface of the microbubble buckles, Rbreak-up is the radius above which the surface shell breaks up, described as Rbuckling(1 + σwater/χ)1/2, σwater is the surface tension of water, and Rruptured is the radius after rupture, described as Rbuckling(1 + σwater/χ)1/2.
Solving this equation was accomplished using the ordinary differential equation solver in Matlab® (The MathWorks, Natick, MA) to find the radius of the UCA versus time. It was assumed that the surrounding medium was a 0.30% 500 kDa Fluorescein isothiocyanate-dextran (FITC-dextran) solution at 20 °C. The driving pulse was described by a 3.15 MHz, 5 cycle cosine pulse, and a Pr of 1 MPa to mimic the pulse used in the sonoporation experiments. A Hanning window was applied to the simulated pulse to make it more representative of an actual transducer pulse. The parameters used in this simulation are listed in Table TABLE I..
TABLE I.
The parameters and values used to solve the Marmottant model.
| Parameter | Value | Description |
|---|---|---|
| ρL | 998 kg/m3 | Fresh water at 20 °C |
| P0 | 101 kPa | Atmospheric pressure |
| κ | 1.07 | For perflouropropane |
| κs | 32 × 10−9 N for Optison | Optison1 |
| 0.5 × 10⁻⁹ N for Definity | Definity2 | |
| c | 1480 m/s | For fresh water at 20 °C |
| µ | 0.002 Pa·s | For 0.30% dextran with 500 kDa (Ref. 3) |
| Pac(t) | Pr cos(2π ft)·0.5·[1 − cos(2π ft/cycle)] | |
| Rbuckling | R0 | 4 |
| χ | 4 N/m for Optison | Optison5 |
| 0.85 N/m for Definity | Definity2 | |
| Rbreakup | Rbuckling(1 + σbreak-up/χ)1/2 | Ref. 4 |
| σbreak-up | 1 N/m | Ref. 4 |
| Rruptured | Rbuckling(1 + σwater/χ)1/2 | Ref. 4 |
| σwater | 0.073 N/m |
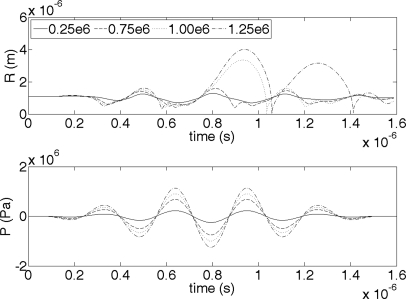
The first UCA examined was a Definity® microbubble with an equilibrium radius of 1.1 μm. To observe the change in oscillation behavior as Pr changes, a range of Pr values were applied (0.25, 0.75, 1.00, and 1.25 MPa). Figure 1 presents the results from the Marmottant model, the radii (R) of the UCA versus time. As is observed from the results, the negative pressure of the driving waveform causes the UCA to grow and the positive pressure of the driving waveform causes the UCA to shrink. At the lowest Pr value (0.25 MPa) this oscillatory behavior of the UCA is linear, with the same duration for the growth and shrinkage of the UCA. For the higher applied Pr values, the oscillatory behavior of the UCA is nonlinear, with a slower expansion than contraction. For the highest applied Pr values (1 and 1.25 MPa), the contraction of the bubble results in a point of discontinuity. Additionally, the maximum radius of the bubble was greater than 2 times the initial radius. Both of those features indicate that at those two pressures, IC of the UCA was occurring within the single applied pulse.
Figure 1.
The radius of a Definity bubble (top) as it changes due to the applied 5 cycle, 3.15 MHz US pulse (bottom) according to the Marmottant model. Each line represents a different Pr, which was varied from 0.25 to 1.25 MPa. R0 was 1.1 μm.
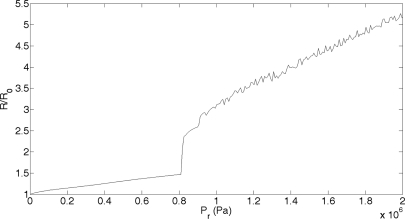
The maximum radius (Rmax) was found for Pr values in the range from 0 to 4 MPa. The condition for bubble collapse is a ratio of Rmax/R0 greater than 2. When this condition is met, the Marmottant model is no longer valid. The model describes the oscillatory behavior of an UCA, not the IC behavior of a bubble. Figure 2 shows the Rmax/R0 for a range of Pr values and the same exposure conditions as for Fig. 1. From these results, the theoretical collapse threshold can be determined for a 1.1 μm Definity microbubble exposed to a 5 cycle, 3.15 MHz pulse in a 0.30% FITC–dextran solution. This threshold, the minimum Pr where Rmax/R0 is equal to 2, is 0.816 MPa. The experimental collapse threshold for Definity in FITC–dextran exposed to a 5 cycle, 3.15 MHz pulse was 0.95 ± 0.22 MPa.3 The theoretical collapse threshold is within the error margin of the experimental collapse threshold. The similarity between the theoretical and experimental results supplies confidence in the applicability of the Marmottant model in describing UCA behavior.
Figure 2.
The ratio of Rmax to R0 for a Definity bubble in a 3.15 MHz pulse over a Pr range from 0 to 4 MPa. When the ratio reaches 2, collapse has occurred.
DESCRIBING THE SHEAR STRESS DUE TO MICROSTREAMING
An oscillating bubble sets up an eddying motion in the surrounding medium that gives rise to microstreaming. The next step of this theoretical development is to determine the acoustic streaming properties of an UCA near a cell. Microstreaming theory finds the shear stress associated with a pulsating bubble near a cell, with knowledge about the initial bubble radius, shear viscosity and density of the medium, frequency of the applied US pulse, and the radial oscillation amplitude of the UCA.9, 10, 11, 12, 13 Shear stress (S) is the final parameter that will be returned from the shear stress-microstreaming model of sonoporation being developed herein.
Rooney9 describes the shear stress associated with microstreaming as
| (3) |
where f is the frequency, η is the shear viscosity of the medium, a is the initial bubble radius, ξ0 is the radial oscillation amplitude, and Δ is the boundary layer thickness. The boundary layer thickness is defined as
| (4) |
where ρ is the density of the medium.10
An oscillating bubble changes its radius with time, as was verified by the Marmottant model. As a result there are two options for finding the S. The first option is to find the time-varying S as the radius changes with time. This will result in an oscillating S. The second option is to calculate S at one particular time point, specifically when the radius equals Rmax. At Rmax, the shear stress will be at its maximum. It is assumed that the maximum shear stress is more important than the oscillating response of the shear stress with respect to impact on the cell membrane. Several articles have shown there is decay in the permeability of the membrane after the ultrasound is turned off. The time scale for a contrast agent, and thus shear stress, to complete one oscillation, is well within the time scales found for cell membrane permeability decay.4, 14 Additionally, the ultimate goal of this theoretical development is to observe how the shear stress changes with Pr. The time-varying S is a complicated result that would add to the complexity of the model without providing significant additional information. As such Rmax will be used to find the ξ0, which will then be used to find S.
The time for a fluid flow to develop due to an oscillating UCA must be considered. Several studies have presented observations of streamlines that develop around a vibrating bubble.9, 15 Through visual observation, the smallest streamline traced was approximately 1 and 2 times the circumference of the bubble, respectively. It will be assumed that one circuit of the streamline is sufficient for a fully developed streaming flow to evolve around a bubble that is initially at rest and then excited by US. If we use the more recent value, then the distance the fluid must travel is 2πA (where A is the initial bubble radius). The limiting tangential fluid velocity (UL) at the surface of the bubble is given by10, 13
| (5) |
Thus, the time (τ) to complete one circuit of the smallest streamline is
| (6) |
If we assume the radial oscillation amplitude is where the UCA undergoes IC (2 times the initial radius), then ξ0 is R0. Thus, τ becomes
| (7) |
Microstreaming would develop within a single pulse of US at all three frequencies. Therefore, in the development of this model it was assumed that the instant US was turned on microstreaming began.
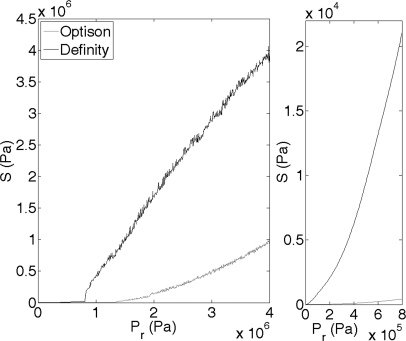
The next step in developing the shear stress-microstreaming model is to find S [Eq. 3] at the maximum Rmax. For this step, the same exposure conditions will be used as in the previous section. A 1.1 μm Definity microbubble is exposed to a 5 cycle, 3.15 MHz pulse in a 0.30% FITC–dextran medium over a range of Pr from 0 to 4 MPa. Figure 3 presents the results of S as a function of Pr. It can be observed that as Pr increases, S increases, just as expected. The same algorithm was applied to a 1.1 μm OptisonTM microbubble under the same exposure conditions, with similar results as those for Definity (Fig. 3). Marmottant and Hilgenfeldt15 demonstrated that unilamellar lipid membranes were ruptured at a shear stress of 10 000 Pa and 180 kHz. From Fig. 3(right), at applied Pr levels of 0–0.8 MPa, S is in the range of 0 to 22 000 Pa for Definity, and 0 to 1300 Pa for Optison. These numbers are of the same order of magnitude as the results by Marmottant and Hilgenfeldt,15 therefore some measure of confidence exists with this model for shear stress.
Figure 3.
(Left) Viscous stress (S) from a Definity (black line) and Optison (gray line) bubble oscillating in a 3.15 MHz field, with PD of 5 cycles and PRF of 10 Hz. Pr was varied between 0 and 4 MPa and R0 was 1.1 μm. (Right) Zoomed in to better appreciate Pr of 0–0.8 MPa.
APPLYING THE SHEAR STRESS MODEL TO THE SONOPORATION DATA
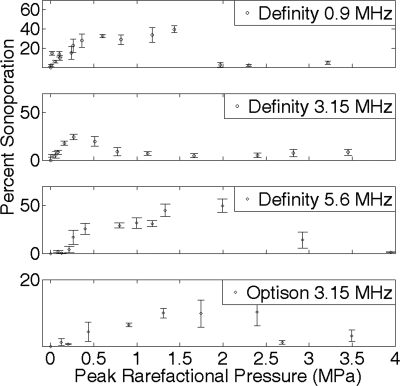
As the theoretical model currently stands, S increases as Pr increases, indefinitely. The sonoporation results show a drop in sonoporation activity above the collapse threshold. Thus, the next step of this development is to refine the model such that the major features of the sonoporation activity over applied Pr are observed in the theoretical model. The experimental results for sonoporation are presented in Fig. 4 for comparison to the theoretical model.2, 3
Figure 4.
Percentage of sonoporated cells for exposures with Definity at center frequencies 0.92, 3.15, or 5.6 MHz and Optison at center frequency 3.15 MHz, with 5 cycle PD, 10 Hz PRF, and for 30 s ED (Refs. 7, 8).
INCORPORATION OF A TIME FACTOR IN THE MODEL
Experimentally and theoretically we have shown the collapse threshold of Definity at 5 cycles and 3.15 MHz to be between 0.8 and 0.9 MPa. Because an UCA will collapse when the threshold is reached, a collapsed UCA will exert its viscous stress for a shorter time than those UCAs that do not collapse. Thus, for Pr values greater than the collapse threshold, the shortened time for oscillation will influence the shear stress observed by the cell membrane. Therefore, the model requires a time component to be included.
The first method to incorporate time involved multiplying S by a time factor (t). The time factor is the time duration an UCA is oscillating due to the applied US pulse. This time factor was chosen with the assumption that the time the cell membrane, in the altered permeability state, is directly proportional to the number of molecules crossing the cell membrane. There are two groups of times to consider: Times for UCAs that do not collapse and times for UCAs that do collapse. The UCAs that do not collapse are present for the entire pulse duration (tPD), thus, in those cases S multiplied by tPD is the time-dependent viscous stress (StPD). For UCA that reach the collapse criterion (Rmax/R0 ≥ 2), the time when the collapse occurs (tcollapse) is used as the time criterion. Thus, for cases where the UCA collapses, Stcollapse is the time-dependent stress. This model assumes that there is only one UCA in solution and the moment it collapses, there are no longer any UCAs present.
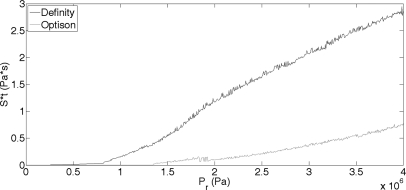
Figure 5 displays St as a function of Pr for a Definity and an Optison microbubble. The trend for St is the same as for S; as Pr increases St increases. The St result is sigmoid-shaped and smoother than S, with the increase in St occurring at a lower Pr than for S. If the simulated results for Optison in Fig. 5 are compared to the experimental results, more similarity of shape can be seen than for the Definity results. At low Pr values, there is an increase in sonoporation just as there is an increase in St as Pr increases. After reaching a maximum, sonoporation and St drop as Pr increases. However, at this point sonoporation remains low and St rises rapidly as Pr increases. Therefore, further refinement of the theoretical model is needed.
Figure 5.
St from a Definity (black line) and an Optison (gray line) bubble oscillating in a single pulse of 3.15 MHz frequency and PD of 5 cycles. Pr was varied between 0 and 4 MPa and R0 was 1.1 μm.
INCORPORATION OF EXPOSURE DURATION INTO THE MODEL
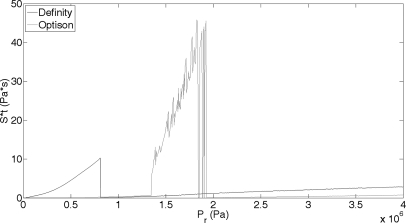
An explanation for the difference between the theoretical and experimental results is the time duration used for the time factor. Currently, the time factor in the model only includes a single pulse. However, experimentally the cells were exposed to the pulsed US conditions for an exposure duration (ED) of 30 s. Thus, the time factor was altered to incorporate the entire ED. For UCAs that collapse, the time factor remains tcollapse (it was assumed that the UCA will collapse within the first applied pulse). UCAs that do not collapse are present for the entire ED, thus Sttotal is used for the uncollapsed UCA. ttotal is defined as the total time the US is turned on during the exposure duration and can be calculated by
| (8) |
where PD is the pulse duration and PRF is the pulse repetition frequency (10 Hz). The results from this modified theoretical model are presented in Fig. 6, with Definity and Optison being exposed at the same conditions as mentioned previously.
Figure 6.
Sttotal from a Definity (black line) and Optison (gray line) bubble oscillating in a 3.15 MHz field and PD of 5 cycles for an ED of 30 s. Pr was varied between 0 and 4 MPa and R0 was 1.1 μm.
These refined results present characteristics more similar to the experimental sonoporation data than the results using only a single pulse. Both Sttotal and sonoporation rises as Pr increases; and both reach a maximum followed by a drop off.
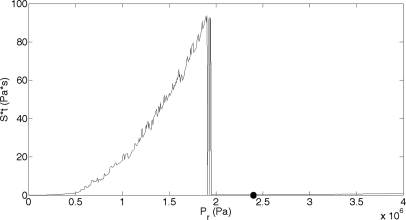
Additionally, if the theoretical results between the two contrast agents, Definity and Optison, are compared to the experimental results, similar relationships are observed. The maximum SA for Definity occurred at a Pr of 0.26 MPa. The theoretical model’s maximum Sttotal occurs at 0.81 MPa. These Pr values for Definity are in reasonable agreement to each other, giving us confidence in the applicability of the model. The maximum SA for Optison occurred at 2.4 MPa, whereas Sttotal exhibited a maximum at 1.75 MPa. These Pr values, although reasonably close (less than an order of magnitude), are still quite far apart It is noted, however, that the theoretical study for Optison was run at 1.1 μm to be identical to the Definity study. The actual mean diameter of Optison is 2–4.5 μm. If the algorithm is run with a mean radius of 2 μm, the maximum Sttotal occurs at 1.94 MPa (Fig. 7). This result for Optison is closer to the experimental results observed. In both the sonoporation data and Sttotal results, Definity reaches a maximum at a Pr 1–2 MPa lower than that for Optison. This theoretical model shows great potential in describing the microstreaming behavior of a single UCA and how the viscous stress from that streaming correlates to sonoporation of the cell.
Figure 7.
Sttotal from a Optison bubble oscillating in a 3.15 MHz field and PD of 5 cycles for an ED of 30 s. Pr was varied between 0 and 4 MPa and R0 was 2 μm. The circle located at 2.4 MPa represents the pressure at which the maximum sonoporation activity occurred under experimental conditions (Ref. 7).
INCORPORATION OF THE DISTRIBUTION OF DEFINITY INTO THE MODEL
Careful study of the theoretical and experimental results reveals one more difference between them. The experimental results displayed a more gradual increase in sonoporation activity as Pr was increased than that observed in the theoretical study. Additionally, the experimental data show more of a plateau when reaching the maximum SA than that observed in the theoretical study. One potential reason for this is that the model currently uses a single UCA at a single radius, whereas a commercial vial of UCAs contains a distribution of sizes. For each radius, this S–ttotal curve will shift left or right on the Pr axis, depending on the UCA size. If this polydispersion of UCA sizes were incorporated into the model, the theoretical model should more accurately represent the experimental results.
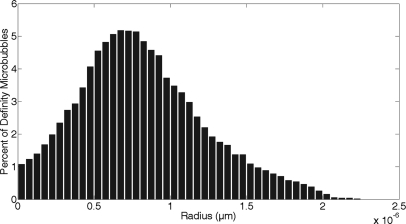
The size distribution of Definity was found using an algorithm developed to measure the radius of the microbubbles on an image. Figure 8 graphically presents the distribution, wherein the radii of Definity varied between 0.025 and 2.23 μm, and the average radius was 0.82 μm. This is similar to the commercial printout that accompanied the Definity vial that stated the mean radius was 0.55–1.65 μm, with 90% of the microbubbles smaller than 10 μm. The distribution of Optison was unable to be measured because Optison was temporarily unavailable for purchase. Therefore, this size modification of the theoretical study was performed only with Definity.
Figure 8.
Size distribution of Definity bubbles immediately following activation.
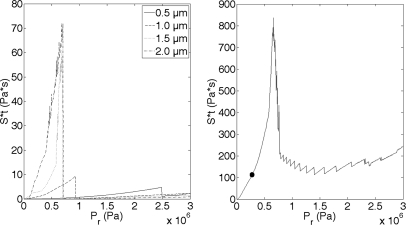
The Sttotal was calculated for every radius found in the Definity distribution. Figure 9a graphically depicts Sttotal for selected single-sized radii sizes using the same exposure conditions as previously mentioned: 5 Cycle, 3.15 MHz pulse in 0.30% FITC–dextran medium. Figure 9 shows that as the microbubble size increases, the maximum value of Sttotal increases. Also note that as microbubble size increases, the Pr value decreases at which Sttotal is a maximum. It can be observed, therefore, that if obtaining the highest possible value of Sttotal were the goal, then larger radii bubbles at lower Pr in the region of the “spike” would be the ideal setup.
Figure 9.
(Left) Sttotal from Definity oscillating in a 3.15 MHz field and PD of 5 cycles for an ED of 30 s for selected radii sizes (0.5, 1.0, 1.5, and 2.0 μm). Pr was varied between 0 and 3 MPa. (Right) The weighted sum of Sttotal for all radii of Definity at the same exposure conditions. The circle located at 0.26 MPa represents the pressure at which the maximum sonoporation activity occurred under experimental conditions (Ref. 8).
COMPARISON OF EXPERIMENTAL RESULTS TO THEORETICAL RESULTS
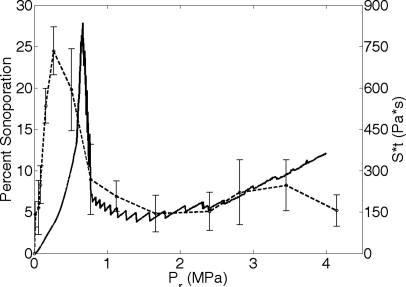
The weighted sum of all the Sttotal was then calculated, using the weights measured from Fig. 8. The resulting weighted sum of Sttotal over all the microbubble radii is plotted in Fig. 9b. To facilitate the comparison to the experimental data, the 3.15 MHz SA results for Definity in FITC–dextran3 are presented with the weighted sum of Sttotal in Fig. 10. There are many similarities between the theoretical and experimental sonoporation results. Both results showed a rise in activity to a maximum as Pr was increased. Following the maximum a rapid drop in activity occurs. Then, as Pr continues to increase the activity remains at a fairly steady lower level. The maximum SA at 3.15 MHz occurred at 0.26 MPa. The maximum Sttotal was at 0.65 MPa. These two results are remarkably close, especially if it is noted that the major portion of the drop-off in SA occurred between 0.51 and 0.77 MPa. The Sttotal maximum occurred in that Pr range. Therefore, the shear stress-microstreaming model is capable of predicting the Pr value at which the maximum Sttotal, and therefore maximum sonoporation occurs. Additionally, the sonoporation activity after the drop off was 20% of the maximum sonoporation activity. The average Sttotal after the drop off was 21% of the maximum Sttotal. These two results again are very similar. The shear stress-microstreaming model is capable of predicting relative quantities of sonoporation activity.
Figure 10.
The weighted sum of Sttotal from Definity oscillating in 3.15 MHz field and PD of 5 cycles for an ED of 30 s and the percentage of sonoporated cells found experimentally at the same exposure conditions (Ref. 8).
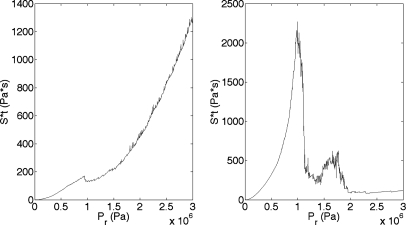
The final test of the shear stress-microstreaming model was to process the model’s algorithm with the other two frequencies that were used in sonoporation studies: 0.92 and 5.6 MHz. The SA is presented in Fig. 4. The 0.92 and 5.6 MHz computational model results are presented in Fig. 11. The theoretical results for 0.92 and 5.6 MHz are not as similar to the experimental sonoporation results as that for 3 MHz. For example, the simulated results for 0.92 MHz show a peak occurring at 0.9 MPa, followed by a shallow decrease in Sttotal. The simulated result decrease is much less dramatic than seen in the experimental results. Additionally, following the Sttotal decrease, the simulated model shows the activity rapidly increasing, whereas the SA experimental results remain low. On the other hand, the 5.6 MHz simulated results show both a dramatic drop in Sttotal after the maximum and for Pr values greater than 2 MPa the activity remains low. The 5.6 MHz simulated results, although, show a second peak, between 1.5 and 2 MPa, after the first maximum peak, at 1 MPa. The 5.6 MHz experimental results do not show this second peak, although the sonoporation is elevated until 2.3 MPa. So in both cases the activity is minimal above 2.3 MPa.
Figure 11.
The weighted sum of Sttotal from Definity oscillating in a (left) 0.92 MHz and a (right) 5.6 MHz field. PD was 5 cycles, ED was 30 s, and Pr was varied between 0 and 3 MPa.
Several features are similar between the computational model results and the experimental data and are worth discussing. The Pr values where the maximum sonoporation activity occurred differed among the three frequencies examined, with the 3.15-MHz results occurring at the lowest Pr, 260 kPa, the 0.92 MHz at the next lowest Pr, 1.4 kPa, and the 5.6 MHz at the highest, 2.3 MPa. The model results revealed the same pattern, the location of the maximum of the 3.15 MHz results was at the lowest Pr, 0.65 MPa, the 0.92 MHz peak occurred at the next lowest Pr, 0.9 MPa, and the 5.6 MHz peak was at the highest Pr, 1.0 MPa (with a second peak at 1.7 MPa). This similarity in trend further emphasizes the likelihood of a microstreaming mechanism for sonoporation. The microstreaming model was able to reasonably predict the relative locations for the maximum sonoporation activity among different center frequencies.
DISCUSSION
The ability of the computational model to mimic the three major features of the sonoporation activity results (maximum sonoporation activity, drop off in sonoporation activity, and relative differences between maximum activity and the activity after drop off) suggests that shear stress due to microstreaming of an oscillating UCA near a cell is a highly likely a physical mechanism of sonoporation. Additionally, these results verify that the shear stress-microstreaming model can be used to predict the sonoporation activity for different UCAs, radius distribution of the UCAs, exposure medium, ED, and PRF.
The objective of this theoretical study is to determine if a model that describes shear stress on a cell due to microstreaming can describe the sonoporation results regarding the major responses with respect to Pr. The shear stress-microstreaming model has accomplished this objective. The discrepancies found between the model and the experimental results suggest, not unexpectedly, that a more sophisticated model is needed to accurately predict sonoporation activity for various exposure conditions. However, this model as presented revealed great potential and emphasized that even with a crude calculation of shear stress due to microstreaming the major sonoporation responses were revealed.
The shear stress-microstreaming model contained several simplifications that would need to be improved upon for future development. The first was the assumption that the moment the US was turned off (or the UCA collapsed) the microstreaming instantaneously stopped. No consideration for the time to develop the fluid flow to stop was considered. Second, it was assumed that the UCA does not move in and out of the US focus; it is within the focus and in close proximity to the cell for the entire ED. Third, it was assumed that each UCA acted independently of each other, but in nature pressure waves radiated by UCAs in a cloud can accelerate, retard, or even reverse the growth and collapse of other UCAs.16, 17, 18 For this theoretical model, microstreaming flow was described for a single UCA and additive flows from nearby UCAs were not considered. Finally, it was assumed that if an UCA collapsed, it collapsed within the first pulse. Although this is the case in the majority of situations, it has been experimentally observed that collapse can occur in the second and third cycles also.19 Thus, this simplified model is only a starting point for a more advanced model to describe sonoporation.
The shear stress-microstreaming model presented verifies microstreaming due to oscillating UCAs as the sonoporation mechanism. More development of the model would be required to utilize it as a predictive tool for sonoporation. However, the objective to verify the ability of the shear stress-microstreaming model to predict sonoporation was achieved.
ACKNOWLEDGMENTS
This work was supported in part by an Illinois Distinguished Fellowship for predoctoral students, by NIH Fellowship No. F31EB06634, and by NIH Grant No. R37EB02641. Cell culture facilities were provided by the Imaging Technology Group of the Beckman Institute for Advanced Science and Technology at the University of Illinois at Urbana-Champaign. A special thank you to Darryl Ma for performing the UCA size distribution measurements.
References
- Forbes M. M., “The role of ultrasound contrast agents in producing sonoporation,” Doctor of Philosophy thesis in Bioengineering, Department of Bioengineering, University of Illinois at Urbana–Champaign, IL, 2009. [Google Scholar]
- Forbes M. M., Steinberg R. L., and W. D.O’Brien, Jr., “Examination of inertial cavitation of Optison in producing sonoporation of Chinese hamster ovary cells,” Ultrasound Med. Biol. 34, 2009–2018 (2008). 10.1016/j.ultrasmedbio.2008.05.003 [DOI] [PMC free article] [PubMed] [Google Scholar]
- Forbes M. M., Steinberg R. L., and W. D.O’Brien, Jr., “Evaluation of the role of Definity® in producing sonoporation of Chinese hamster ovary cells at 0.92, 3.15, and 5.6 MHz,” J Ultrasound Med. 30, 61–69 (2011). [DOI] [PMC free article] [PubMed] [Google Scholar]
- van Wamel A., Kooiman K., Harteveld M., Emmer M., ten Cate F. J., Versluis M., and de Jong N., “Vibrating microbubbles poking individual cells: Drug transfer into cells via sonoporation,” J. Contr. Release 112, 149–155 (2006). 10.1016/j.jconrel.2006.02.007 [DOI] [PubMed] [Google Scholar]
- Prosperetti A., “A new mechanism for sonoluminescence,” J. Acoust. Soc. Am. 101, 2003–2007 (1997). 10.1121/1.418133 [DOI] [Google Scholar]
- Brujan E., Nahen K., Schmidt P., and Vogel A., “Dynamics of laser-induced cavitation bubbles near elastic boundaries: Influence of the elastic modulus,” J. Fluid Mech. 433, 293–314 (2001). [Google Scholar]
- Marmottant P., van der Meer S., Emmer M., Versluis M., de Jong N., Hilgenfeldt S., and Lohse D., “A model for large amplitude oscillations of coated bubbles accounting for buckling and rupture,” J. Acoust. Soc. Am. 118, 3499–3505 (2005). 10.1121/1.2109427 [DOI] [Google Scholar]
- Nyborg W. L., Physical Acoustics: Principles and Methods (Academic, New York, 1964), Vol. 2, Part B. [Google Scholar]
- Rooney J. A., “Hemolysis near and ultrasonically pulsating gas bubble,” Science 169, 869–871 (1970). 10.1126/science.169.3948.869 [DOI] [PubMed] [Google Scholar]
- Coakley W. T. and Nyborg W. L., “Cavitation; dynamics of gas bubbles; applications,” in Ultrasound: Its Applications in Medicine and Biology, edited by Fry F. J. (Elsevier, Amsterdam, The Netherlands, 1978), Chap 2, pp. 77–159. [Google Scholar]
- Elder S. A., “Cavitation microstreaming,” J. Acoust. Soc. Am. 30, 54–64 (1959). 10.1121/1.1907611 [DOI] [Google Scholar]
- NCRP, “Exposure criteria for medical diagnostic ultrasound: II. Criteria based on all known mechanisms,” National Council on Radiation Protection and Measurements, Bethesda, MD, 2002, p. 140. [Google Scholar]
- Nyborg W. L., “Acoustic streaming near a boundary,” J. Acoust. Soc. Am. 30, 329–339 (1958). 10.1121/1.1909587 [DOI] [Google Scholar]
- Deng C. X., Sieling F., Pan H., and Cui J., “Ultrasound-induced cell membrane porosity,” Ultrasound Med. Biol. 30, 519–526 (2004). 10.1016/j.ultrasmedbio.2004.01.005 [DOI] [PubMed] [Google Scholar]
- Marmottant P. and Hilgenfeldt S., “Controlled vesicle deformation and lysis by single oscillating bubbles,” Nature (London) 423, 153–156 (2003). 10.1038/nature01613 [DOI] [PubMed] [Google Scholar]
- Hamilton M. F., Ilinskii Y. A., Meegan G. D., and Zabolotskaya E. A., “Interaction of bubbles in a cluster near a rigid surface,” ARLO 6, 207–213 (2005). 10.1121/1.1930967 [DOI] [Google Scholar]
- Pishchalnikov Y. A., Sapozhnikov O. A., Bailey M. R., J. C.Williams, Jr., Cleveland R. O., Colonius T., Crum L. A., Evan A. P., and McAteer J. A., “Cavitation bubble cluster activity in the breakage of kidney stones by lithotriptor shockwaves,” J. Endourol. 17, 435–446 (2003). 10.1089/089277903769013568 [DOI] [PMC free article] [PubMed] [Google Scholar]
- Prentice P. A. and Campbell P. A., “Ultrasound-stimulated mutual interaction forces between optically configured micro-bubble pairs,” Paper presented at Sixth International Symposium on Therapeutic Ultrasound Conference Proceedings, 2007.
- Flynn H. G. and Church C. C., “Transient pulsations of small gas bubble in water,” J. Acoust. Soc. Am. 84, 985–998 (1988). 10.1121/1.396614 [DOI] [PubMed] [Google Scholar]


