
Figure 3.
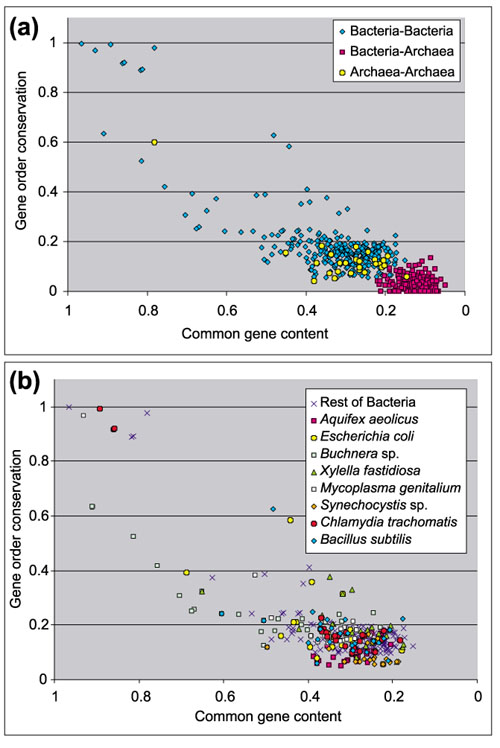
Conservation of gene order in relation to common gene content within and between prokaryotic domains. Each point represents a pair of species. (a) Results for all species. (b) Same plot as in (a), but with Archaea removed and values for some bacterial species highlighted.