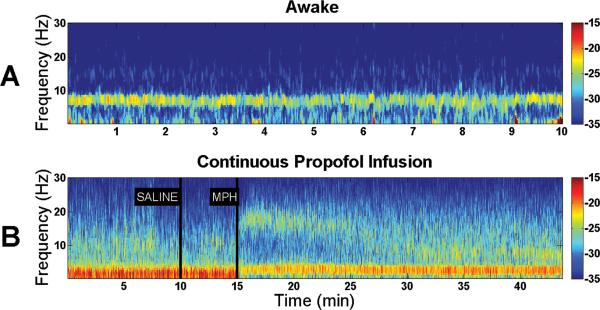
Fig. 4.
Spectral analysis of electroencephalogram data reveals a shift in power induced by methylphenidate during a continuous target controlled infusion of propofol. Warm colors (e.g. red) represent higher power at a given frequency, while cool colors (e.g. blue) represent lower power. (A) A representative spectrogram computed from a rat in the awake state shows predominance of theta power (4–8 Hz). (B) A representative spectrogram computed from a rat during propofol general anesthesia shows predominance of delta power (<4 Hz) before and after administration of normal saline. However, administration of methylphenidate (MPH, 5 mg/kg IV) promptly reduced delta power, and increased theta (4–8 Hz) and beta power (12–30 Hz), providing evidence for a new arousal state distinct from the baseline awake state.

