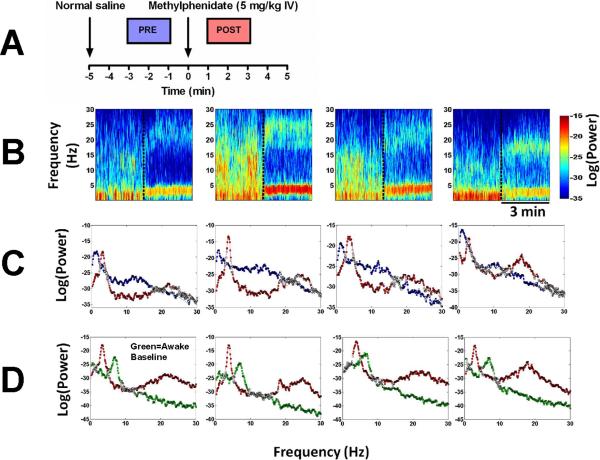
Fig. 5.
Electroencephalogram power spectra and spectrograms computed for each of 4 animals reveal a consistent shift in peak power from delta to theta and beta after administration of methylphenidate during continuous propofol general anesthesia. (A) A schematic showing the two-minute windows used to compute power spectra before methylphenidate administration (blue, “PRE”), and after methylphenidate administration (red, “POST”). (B) Spectrograms computed from 4 different animals that received methylphenidate at the time point indicated by the vertical dashed line. (C) Power spectra computed from the same animals with results of the Kolmogorov-Smirnov test for the two-minute periods before (blue) and after (red) methylphenidate administration. At a 0.05 significance level (with Bonferonni correction) the Kolmogorov-Smirnov test rejects the null hypothesis at all frequencies except those marked with white squares. Statistically significant changes occurred at most frequencies between 0–30 Hz. (D) Power spectra computed from the same animals with results of the Kolmogorov-Smirnov test, comparing a two-minute period from the baseline awake state in the absence of any drugs (green) to the two-minute period after methylphenidate administration during continuous propofol general anesthesia (red). Statistically significant changes occurred at most frequencies between 0–30 Hz.

