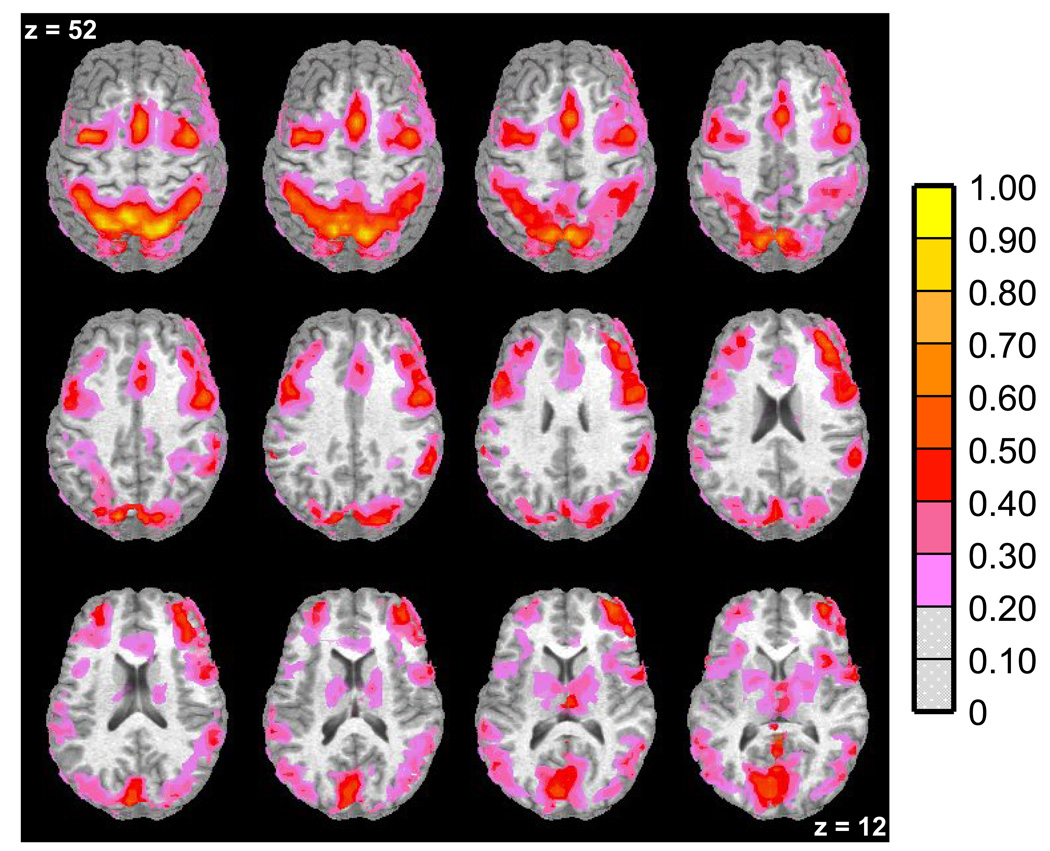
Figure 3. Functional Magnetic Resonance Imaging (fMRI) Results – Whole-Brain Analysis Results for all Groups.
Axial slices (top left z = 52 through bottom right z = 12, spacing = 8 mm) displaying regions with significant percent signal increase (indicated by the color scale) associated with volitional saccade performance in all groups. This one-sample t-map was used to determine regions of interest (ROIs). The background anatomical image is a structural image from one subject in neurological convention (left hemisphere on the left).

