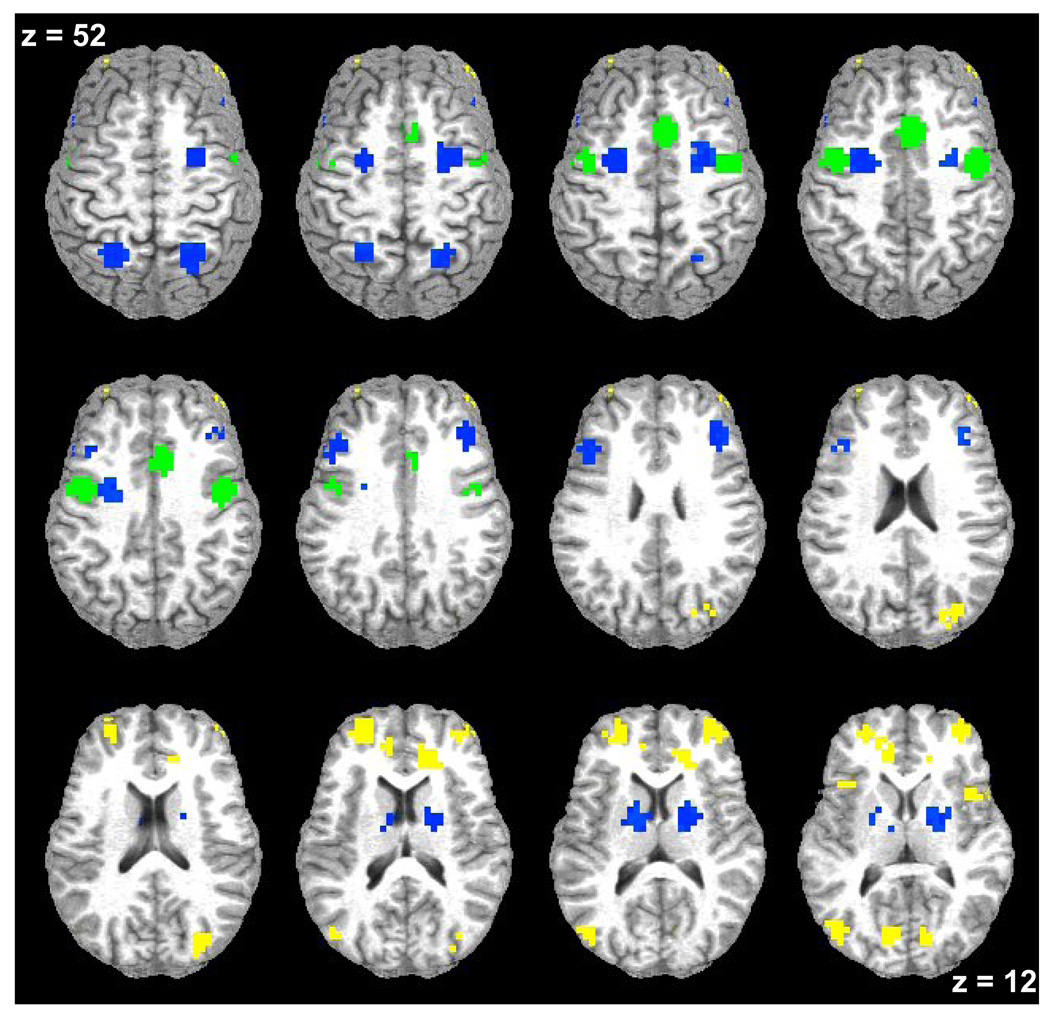
Figure 4. Functional Magnetic Resonance Imaging (fMRI) Results – Differences between Groups.
Axial slices (top left z = 52 through bottom right z = 12, spacing = 8mm) displaying regions of interest with significant blood-oxygen-level-dependent signal increase associated with volitional task performance color coded by pattern of result. Regions in which all three groups showed task-related signal change are shown in blue. Regions in which the only the schizophrenia group is decreased are shown in green. Regions in which the schizophrenia and relative groups are decreased are shown in yellow. The background anatomical image is a structural image from one subject in neurological convention (left hemisphere on the left).

