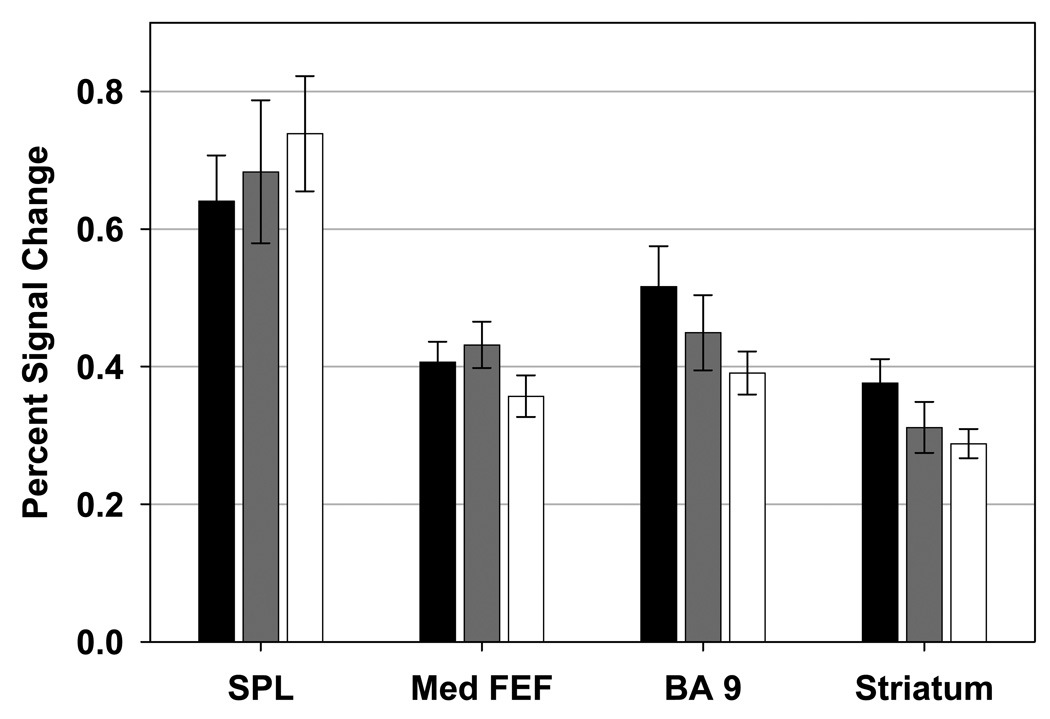
Figure 5. Regions of Interest with no Significant Differences between Groups.
Bar graphs showing mean percent signal change (and standard error) for the healthy participant (black), relative (gray), and schizophrenia (white) groups. Regions of interest depicted showed no significant differences in task-related signal change between groups. SPL: superior parietal lobule, Med FEF: medial frontal eye fields, BA 9: brodmann area 9.

