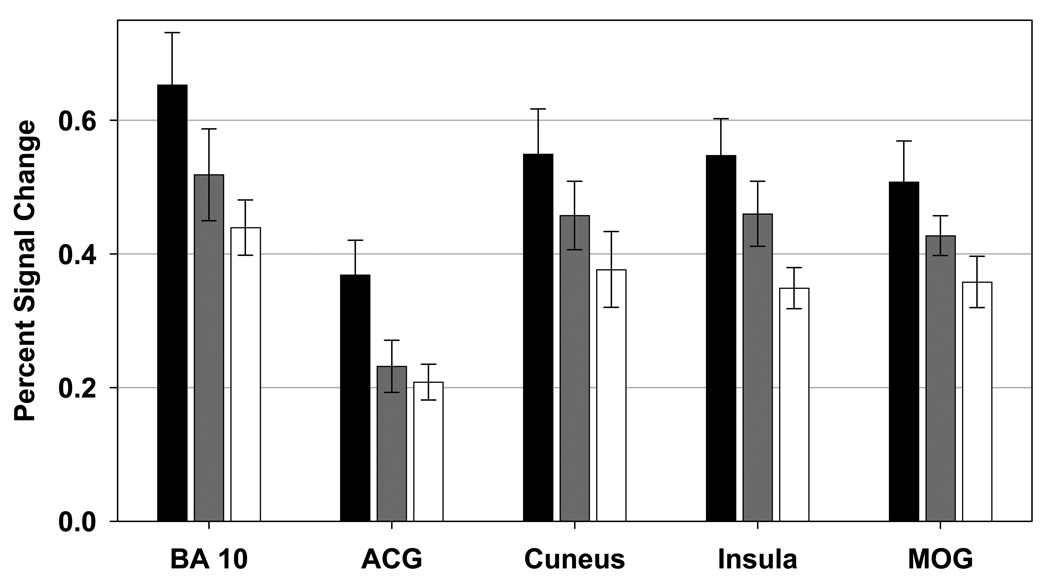
Figure 7. Regions of Interest in which both the Schizophrenia and Relative Groups Showed Decreased Activation.
Bar graphs showing mean percent signal change (and standard error) for the healthy participant (black), relative (gray), and schizophrenia (white) groups. Regions of interest depicted showed lower task-related signal change in the schizophrenia group than in the healthy participant group. Task-related signal change in the relative group did not differ from either the schizophrenia or normal groups. BA 10: brodmann area 10, ACG: anterior cingulate gyrus, MOG: middle occipital gyrus.

