Fig. 1.
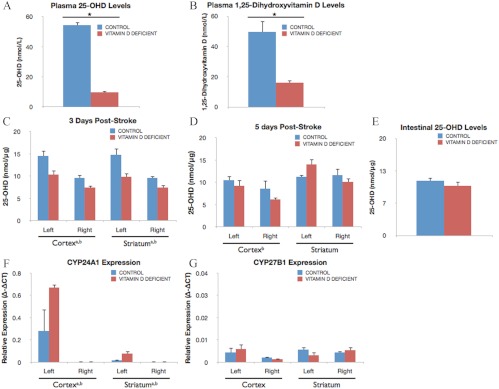
Effect of VDD diet on circulating and local 1,25-OH2D and 25-OH vitamin D levels. A and B, Vitamin D levels were measured in plasma from animals fed a VDD diet or a control diet for 8 wk. The VDD diet significantly reduced circulating vitamin D (25-OHD) levels to 22% of observed levels in rats fed control chow (*, P < 0.05) (A) and circulating activated vitamin D (1,25-OH2D) levels to less than 33% of control levels (*, P < 0.05) (B), respectively. Histograms depict mean ± sem. C, Brain levels of 25-OH vitamin D. Vitamin D was measured in lysates from the ischemic (left) and nonischemic (right) hemisphere at d 3 after MCAo surgery. Vitamin D levels were significantly higher in tissues from control diet-fed animals as compared with VDD diet animals (a, Main effect of diet). Ischemia elevated 25-OHD levels in both the cortex and striatum at 3 d (b, Main effect of ischemia). D, At 5 d after MCAo, there were no significant differences in vitamin D levels in brain tissue derived from VDD diet animals vs. controls. In the ischemic cortex, vitamin D levels remained elevated above nonischemic levels at 5 d after stroke but not in the striatum. E, Small intestine 25-OHD levels. Vitamin D levels were measured in the intestine, an unrelated tissue classically associated with vitamin D, for comparison with brain tissue measurements. As in the brain, VDD diet did not significantly affect intestinal 25-OHD levels. F and G, Expression of genes coding for vitamin D metabolic deactivating CYP24A1 and activating CYP27B1 enzymes was quantified in brain tissue at 5 d. F, CYP24A1 expression was significantly increased in animals fed VDD diet in the ischemic cortex and striatum (a, Main effect of diet). Injury further resulted in greater elevation of CYP24A1 in the ischemic hemisphere of both groups as compared with nonischemic tissues (b, Main effect of ischemia). G, No significant differences were found in CYP27B1 expression levels. Data were analyzed by two-way ANOVA for diet treatment and ischemia for each region; a, Main effect of diet; b, main effect of ischemia. Group differences were considered significant at P ≤ 0.05. Bars represent mean ± sem; n = 4–7 in each group.

