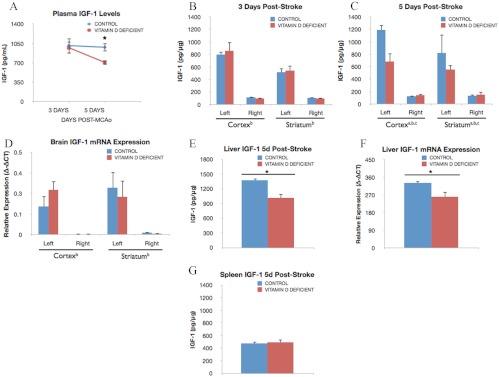
Fig. 4.
Effect of VDD diet on circulating and local IGF-I. A, Plasma IGF-I levels were measured at 3 and 5 d after ischemia in control and VDD female rats. At 3 d after stroke, plasma IGF-I levels were similar in VDD and control groups. However, by 5 d after stroke, IGF-I levels were sustained in control diet animals, whereas peptide levels were decreased in the VDD diet group. Thus, circulating IGF-I levels were reduced 38.5% of the levels observed in control chow-fed animals (*, P < 0.05). Data points represent mean ± sem. B, IGF-I levels in the brain 3 d after ischemia in VDD and control animals. Lysates from the ischemic (left) hemisphere had significantly greater IGF-I expression compared with the nonischemic (right) hemisphere (b, Main effect of ischemia). Diet did not affect IGF-I levels in either the cortex or striatum at 3 d after ischemia. C, At 5 d after ischemia, local IGF-I levels were still elevated in the ischemic hemisphere compared with the ischemic side (b). However, at 5 d after stroke, IGF-I levels were significantly elevated in the cortex and striatum of control animals compared with VDD animals (c, Interaction effect of diet treatment and ischemia). VDD attenuated IGF-I levels in ischemic cortical (75.5%) and striatal (47.2%) tissues. D, IGF-I mRNA expression in the brain 5 d after stroke. Similar to IGF-I protein, IGF-I mRNA levels were significantly greater in the ischemic hemisphere (b). However, diet did not affect IGF-I mRNA levels in the cortex or striatum. E and F, Liver expression of IGF-I. At 5 d after ischemia, IGF-I protein (E) and mRNA (F) levels were significantly reduced (35.14 and 28.0%, respectively) in VDD liver tissue as compared with liver from controls (*, P < 0.05). Data points represent mean ± sem. For comparison, IGF-I levels in the spleen, a peripheral lymphoid organ known to respond to hypoxia, are shown 5 d after stroke. G, Unlike liver tissue, splenic IGF-I levels were not affected by diet. Data were analyzed by three-way ANOVA for diet treatment, ischemia, and region as repeated measures; a, Main effect of diet; b, main effect of ischemia; c, interaction effect of diet treatment and ischemia. Group differences were considered significant at P ≤ 0.05. Bars represent mean ± sem; n = 4–7 in each group.

