
Fig. 3.
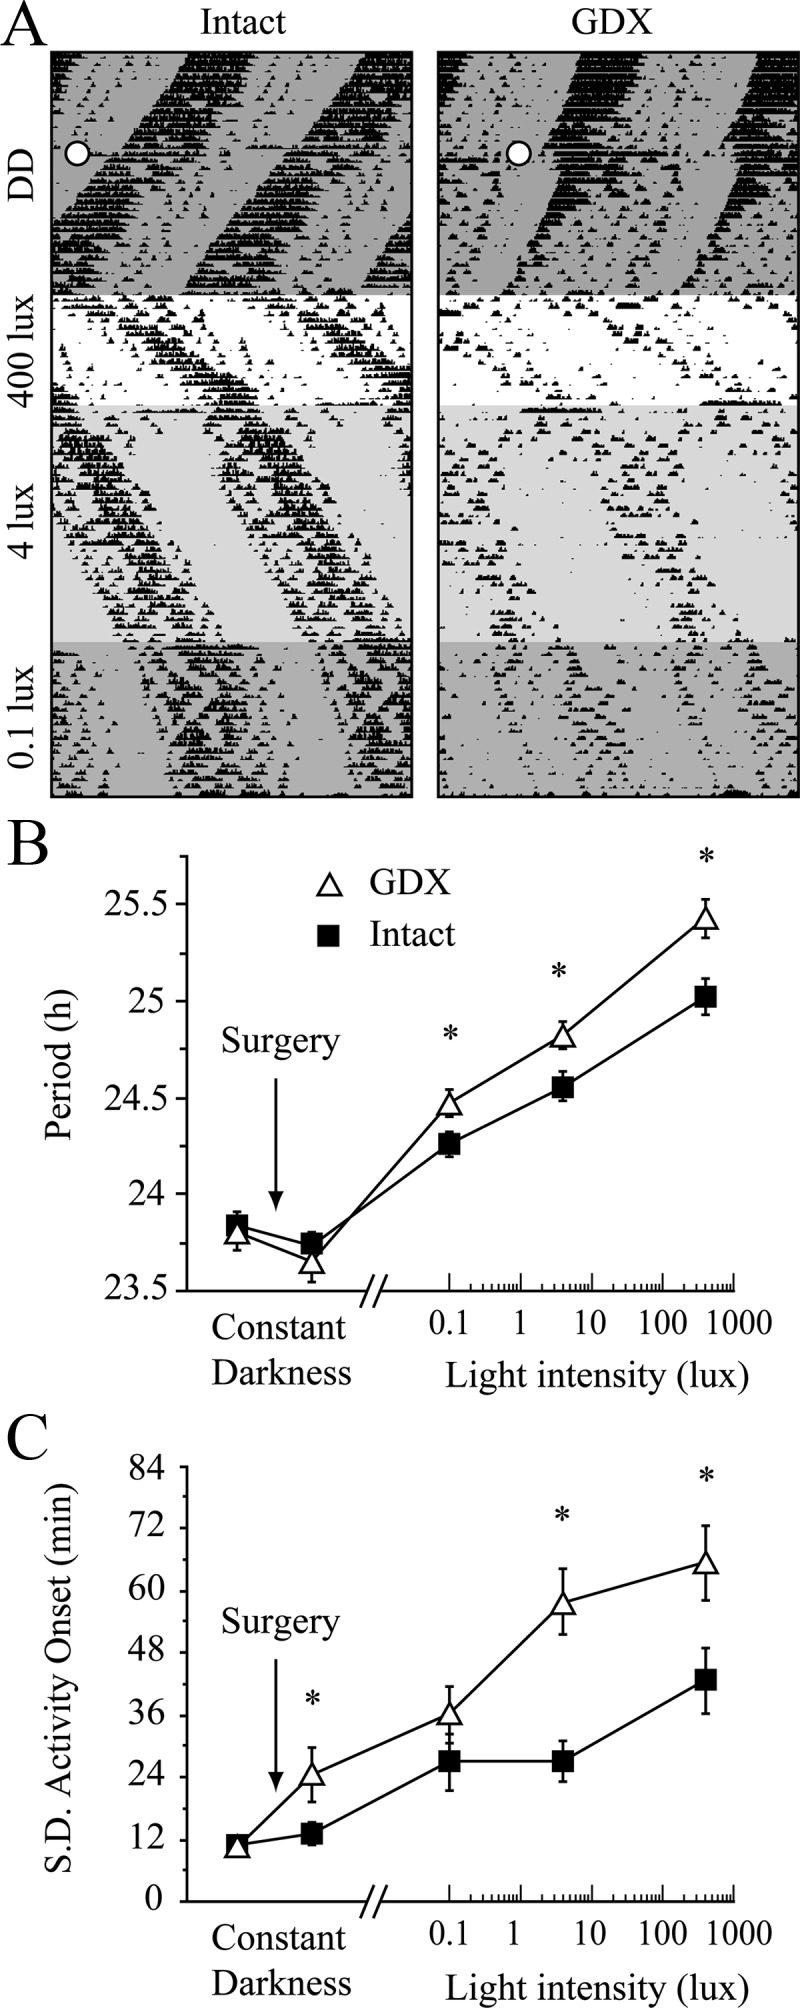
Effects of photic intensity on circadian period and onset variability. A, Representative actograms show the intensity-dependent lengthening of period in LL. Open circles indicate the time of sham surgery or GDX in DD. B and C, Quantification of the effects of endocrine status on circadian period (B) and the sd of activity onset (C) in DD and three intensities of LL. *, P < 0.05, Tukey test.