
Fig. 4.
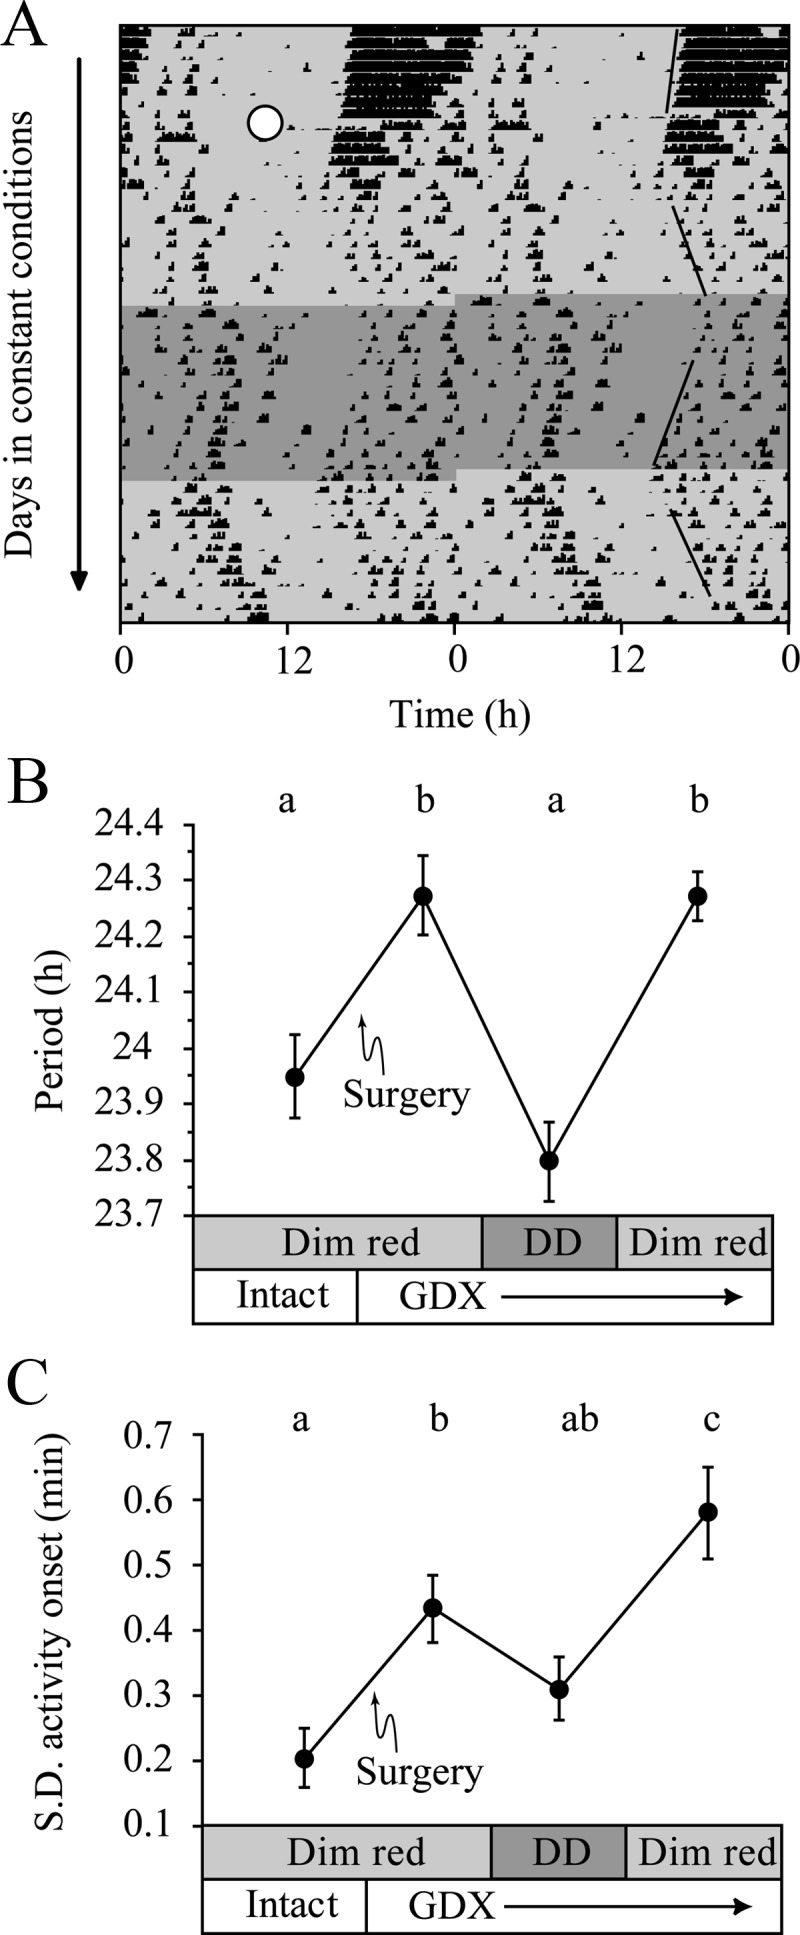
Tonic effects of LL are reversed in DD. A, Representative actogram of a GDX (white circle) mouse housed in dim red LL (light gray), then in DD (dark gray) for 2 wk, and then returned to dim red LL. Best-fit regression lines through onset are shown on the right. B, Period lengthens after GDX, and this is reversed by DD housing. Light and endocrine status are indicated on the x-axis. C, Variability of activity onset increases after GDX; variability is decreased in DD and increased in LL. Different letters indicate significant differences (Tukey test).