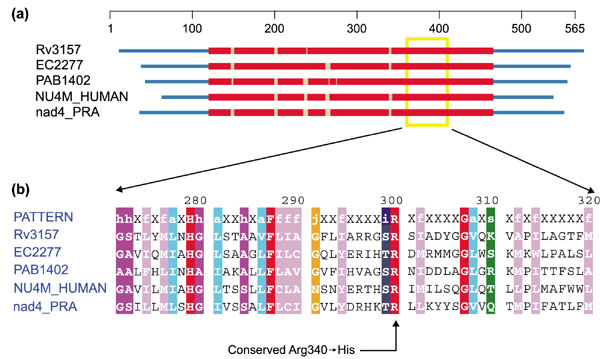
Figure 1.

Profile-induced multiple alignment of NADH dehydrogenase, subunit 4. (a) Protein domain diagram. Profile-aligned regions (in red) set the boundaries for sequence domains. Gaps are indicated by gray interruptions in the red bars. Coordinates in the domain diagram are based on the aligned set of sequences. Amino-acid position is given on the scale above. (b) The zoomed-in aligned region marked by the yellow box on the domain diagram (see Additional data files). The alignment is colored according to amino-acid class assignments, with red indicating identity. Coordinates in the aligment are taken from the position in the profile. For more details see [48, 53]. Sequences are obtained from Mycobacterium tuberculosis (Rv3157), Escherichia coli (EC2277), Pyrococcus abyssi (PAB1402), Homo sapiens mitochondrion (NU4M_HUMAN) and Reclinomonas americana mitochondrion (nad4_PRA).
