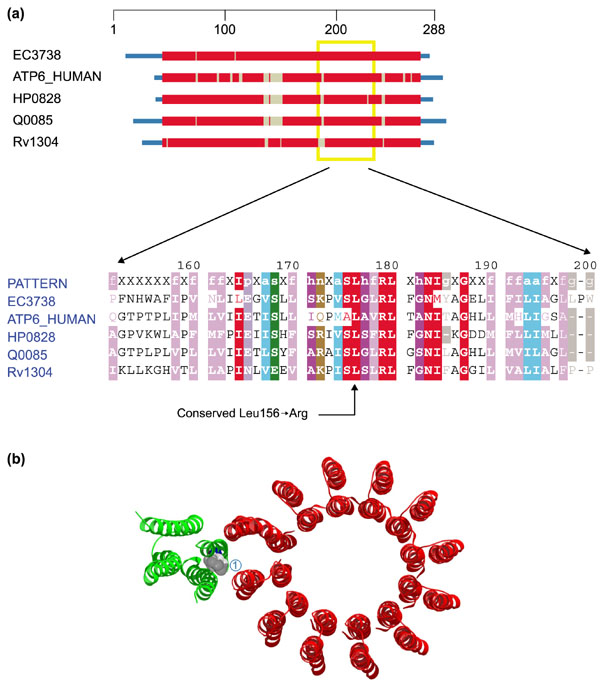
Figure 4.

Domain diagram and structure of ATP synthase. (a) Domain diagram and partial alignment for ATP synthase, subunit 6 (ATP6). The column indicated by the arrow at the bottom corresponds to position 156 of ATP6_HUMAN. Sequences are obtained from M. tuberculosis (Rv1304), Helicobacter pylori (HP0828), E. coli (EC3738), S. cerevisiae mitochondrion (Q0085) and H. sapiens mitochondrion (ATP6_HUMAN). Colors are as in Figure 1. (b) Ribbon diagram showing the structure of ATP synthase subunits: ATP6 (a-chain, green) and ATP9 (c-chain, red). Leucine 156 (1) is shown as a space-filling model. The structure comes from the Protein Data Bank (code: 1C17).
