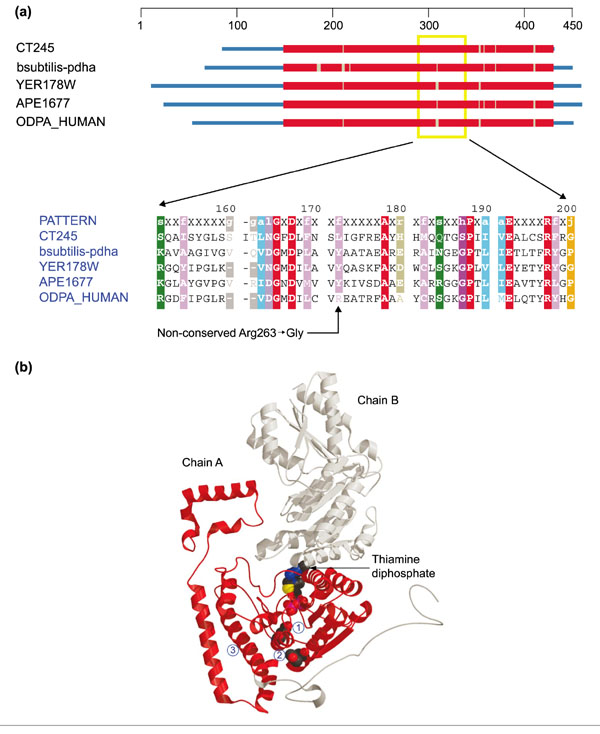
Figure 5.

Structures of pyruvate dehydrogenase E1-α subunit and branched-chain α-ketoacid dehydrogenase α subunit. (a) Domain diagram and partial alignment for pyruvate dehydrogenase E1-α subunit (PDHA1). The column indicated by the arrow at the bottom corresponds to position 263 of ODPA_HUMAN. Sequences come from Chlamydia trachomatis (CT245), Bacillus subtilis (bsubtilis-pdha), S. cerevisiae (YER178W), Aeropyrum pernix (APE1677) and H. sapiens (ODPA_HUMAN). Colors are as in Figure 1. (b) Ribbon diagram of branched-chain α-ketoacid dehydrogenase α subunit (H. sapiens) - a close homolog to PDHA1 (Z-score 73.2). The structure comes from the Protein Data Bank ([49]; code: 1DTWA). Chain A is colored red, chain B gray. A space-filling model of thiamine diphosphate (TPP) (center) indentifies the enzyme active site. Below and slightly to the left, the catalytic group Glu92 is also shown in space-filling representation (1), and further down (directly under the TPP) Tyr262 is similarly shown (2). Arg263 occupies this position in ODPA_HUMAN. Helix H3 is the second helix at the lower left (3).
