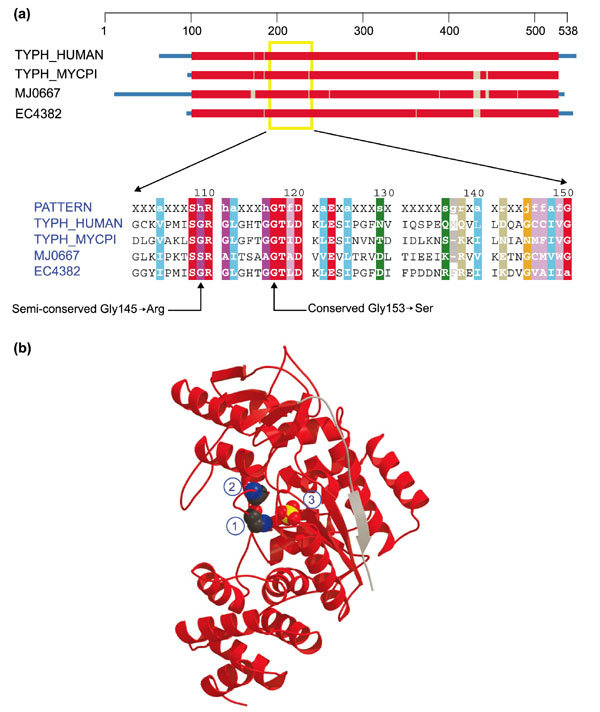
Figure 8.

Domain diagram and structure of thymidine phosphorylase (TP). (a) Domain diagram and partial alignment for thymidine phosphorylase. The columns indicated by arrows at the bottom correspond to positions 145 and 153 of TYPH_HUMAN. Sequences are obtained from H. sapiens (TYPH_HUMAN), Mycoplasma pyrum (TYPH_MYCPI), Methanococcus jannaschii (MJ0667) and E. coli (EC4382). Colors are as in Figure 1. (b) Ribbon diagram of TP (E. coli). Structure from the Protein Data Bank (code: 2TPT). Space-filling representations show a sulfate ion (center) (3) and two conserved glycines (left), the lower of which (1) aligns with Gly145 in TYPH_HUMAN and the other (2) with Gly153 in TYPH_HUMAN.
