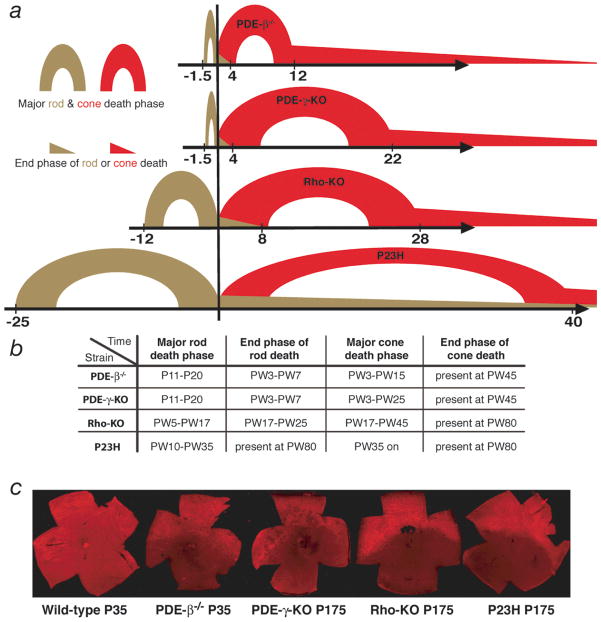
Figure 3.
(a) Schematic representation of the rod and cone death kinetics found in the 4 mouse models of RP. The onset of cone death is set as time zero. The corresponding time windows on the x-axis are given in weeks. For the major rod death phase see text. The major cone death phase was the time until roughly 85% of cones had died. The end phase of cone death was the time thereafter. (b) Summary of rod and cone death kinetics. Time is indicated in postnatal days (P) or postnatal weeks (PW). (c) Immunofluorescence on retinal flat mounts showing the ventral reduction of red/green opsin expression found in the 4 mutants during cone degeneration. Strain and time, in postnatal days, are indicated below each image. (For higher magnification of wild type see figure 2b).

