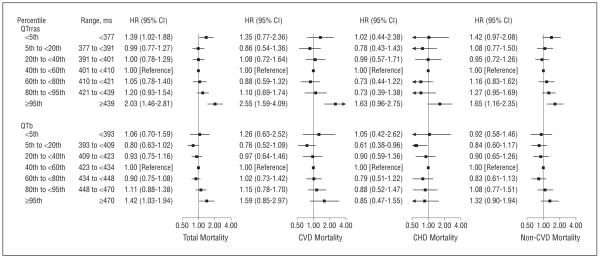
Figure 1.
Multivariate-adjusted hazard ratios (HRs) for total mortality rate and mortality due to cardiovascular disease (CVD), coronary heart disease (CHD), and non-CVD causes. Mortality end points were associated with age-, sex-, race-, and R-R interval–corrected QT interval (QTrras) and Bazett heart rate–corrected QT interval (QTb). Models were adjusted for age; race or ethnicity (non-Hispanic white, non-Hispanic black, Mexican American, or other); sex; R-R interval (restricted quadratic splines with knots at the 5th, 50th, and 95th percentiles); body mass index (calculated as weight in kilograms divided by height in meters squared); smoking status (current, former, or never); alcohol consumption (<12 or ≥12 drinks in the past year); high school education (<12 years or ≥12 years); annual household income (<$20 000 or ≥$20 000); levels of total and high-density lipoprotein cholesterol, serum potassium, and serum calcium; systolic blood pressure; use of blood pressure–lowering medication; diabetes mellitus; history of myocardial infarction; history of congestive heart failure; use of QT-prolonging medications; and use of β-blockers. Wald test P values for testing the association of QTrras categories with mortality end points were less than .001 for total mortality and CVD mortality, .02 for CHD mortality, and .008 for non-CVD mortality. The corresponding P values for QTb were .08, .24, .49, and .28, respectively. CI indicates confidence interval.

