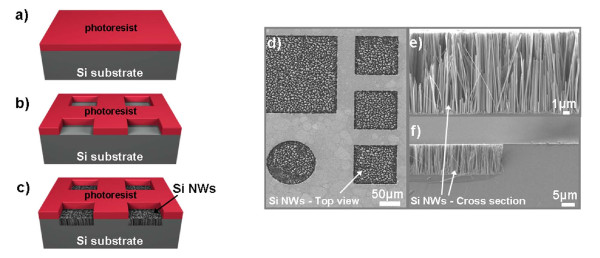
Figure 3.
A schematic representation and SEM images of SiNWs formed on the confined area. (a, b, c) show the process flow for SiNW formation by MACE on the confined areas, while (d) depicts top-view SEM images of the etched confined areas. In (e) and (f), we see examples of cross-sectional SEM images of the SiNWs. The edge of the etched area is illustrated in (f), depicting that the etching process is relatively anisotropic.

