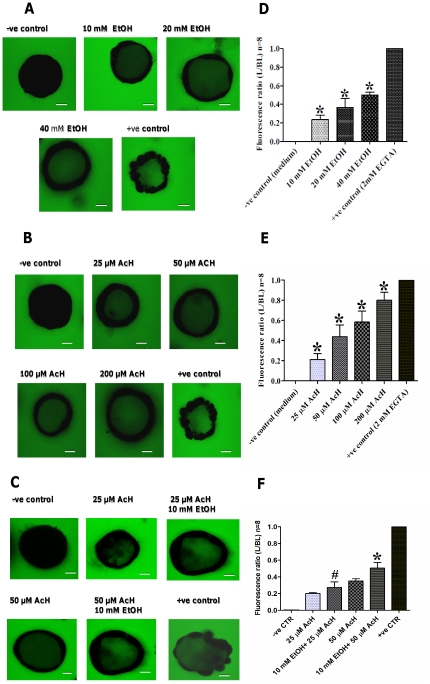
Figure 3. Ethanol and acetaldehyde and in combination increase permeation of the fluorescent marker FD4 from the basolateral to the luminal side of Caco-2 spheroids.
[A–C] Spheroids were exposed at the basal side, in the presence of FD4, to medium only (−ve control), 2 mM EGTA (+ve control) and either 10 mM, 20 mM, 40 mM ethanol (panel A), 25 µM, 50 µM, 100 µM or 200 µM acetaldehyde (panel B) or in combination (panel C). Intraluminal accumulation of FD4 (green) was measured using confocal microscopy (original magnification, ×63) and representative images captured from the middle transsection of spheroids are shown and the bars indicate 10 µm. Ethanol, acetaldehyde and in combination increase FD4 permeation dose-dependently in Caco-2 spheroids. [D–F] The mean fluorescence intensity of FD4 from 8 spheroids was measured and expressed as the ratio of the luminal (L) over the basal (BL) compartment. The L/BL ratio of EGTA exposure (maximal TJ disruption) was set to 1. All graphs indicate the results of three replicate experiments. Data were expressed as means±SD, for ethanol (D), for acetaldehyde (E) and for combination (F), *P<.0001.

