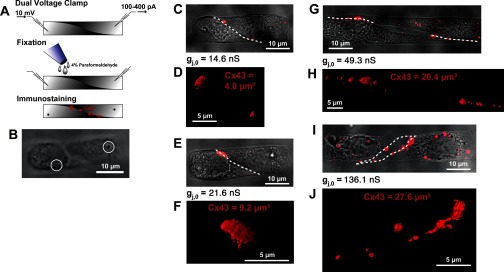
Fig. 4.
Relationship between Cx43 immunofluorescence and gj in individual cell pairs. A: illustration of procedure used to correlate Cx43 immunofluorescence and gj in individual pairs. Following dual-voltage clamp recordings, cardiomyocyte pairs were immediately fixed and immunostained for Cx43, which was followed by quantitative image analysis. B: the withdrawal of the patch electrodes after fixation enabled the identification of the pair by the suction marks of the electrodes (white circles), in addition to the labeling system shown in Fig. 1. C–J: phase-contrast images of representative patched cardiomyocytes pairs (C, E, G, I) are overlaid with the contour of the cell-to-cell junction (white dashed lines) and the maximum projection of Cx43 immunofluorescence (red). 3D reconstructions of the junctional Cx43 immunosignal (D, F, H, J) are shown. The measured Cx43 volume and gj are indicated for each pair.

