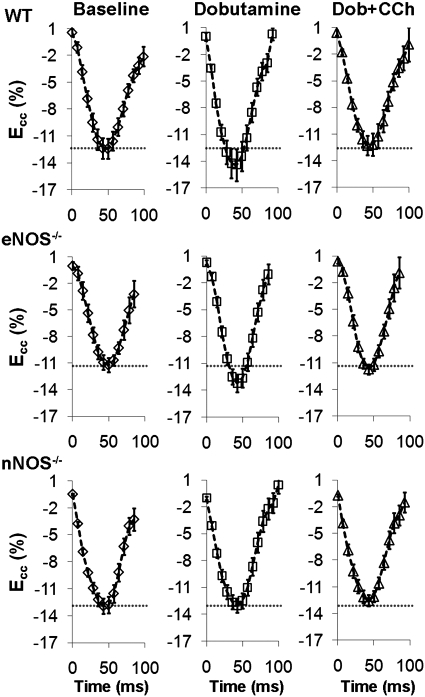
Fig. 4.
Sample midwall circumferential strain (Ecc) vs. time curves from WT (top), eNOS−/− (middle), and nNOS−/− (bottom) mice at baseline and in response to infusion of Dob and Dob + CCh. In WT and eNOS−/− mice, peak Ecc increased significantly from basal levels (dotted gray line) in response to Dob and returned to basal levels following administration of Dob + CCh. In nNOS−/− mice, no change in Ecc was seen in response to either Dob or Dob + CCh.

