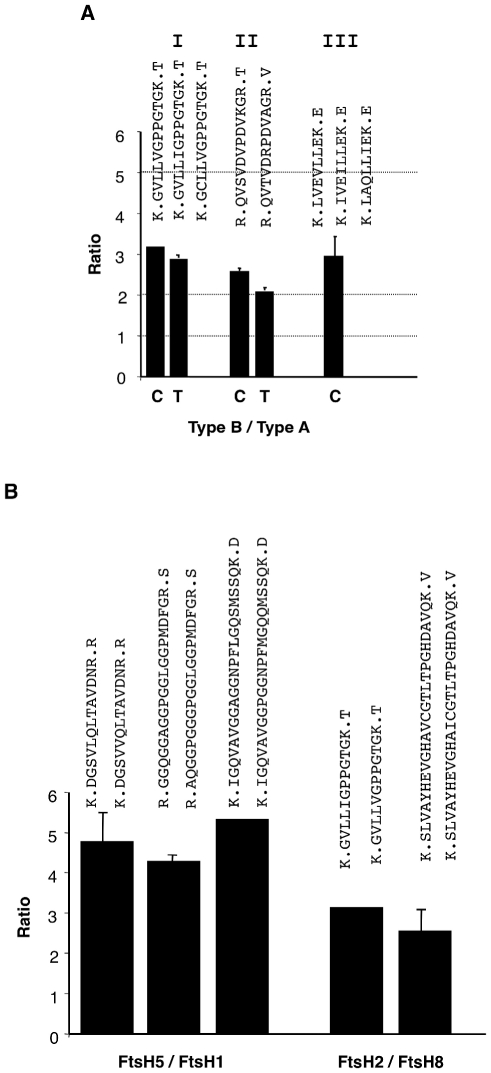
Figure 6. Relative abundance of FtsH subunits.
The abundance of FtsH subunits was deduced from the peak area of specific peptides identified in the MS analysis. (A) Ratios between ‘type B’ and ‘type A’ subunits in isolated complexes (C) and intact thylakoids (T). The Roman numerals correspond to those indicated in Figure 4. The horizontal dashed lines represent possible ratios within the hexamer. (B) Ratios between the products of duplicated genes within a type. The sequences of the peptides used in the analysis are indicated above the bars. Values are averages ±s.d. of 2–4 replicates.

