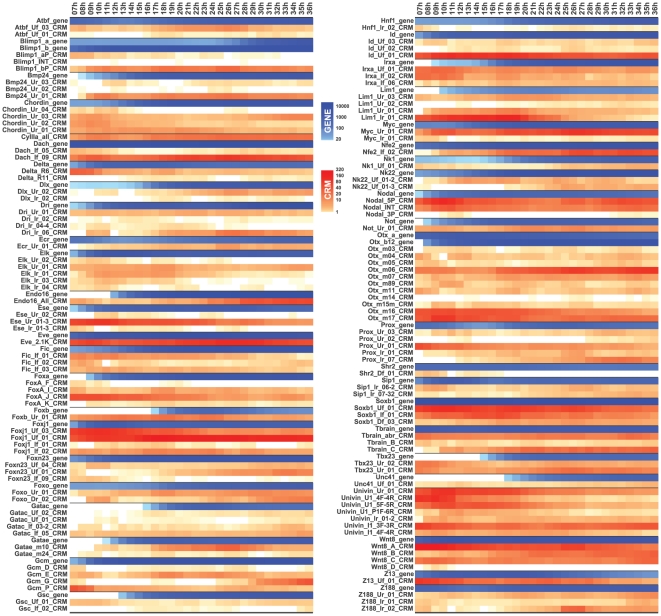
Figure 3. Hourly temporal profiles of CRM activities and gene expressions in developing sea urchin embryos.
High resolution temporal profiles of genes and CRMs. Expression levels of the 46 genes (blue) and activities of CRMs (red) from each gene are shown in the order of 5′ to 3′ side of the gene. Temporal gene expressions were taken from Materna et al [17]. Scale of color at each time point (h) is proportional to the averages of three adjacent time points, h−1, h, and h+1. Numbers shown on the scale bar indicate the numbers of transcripts per embryo.

