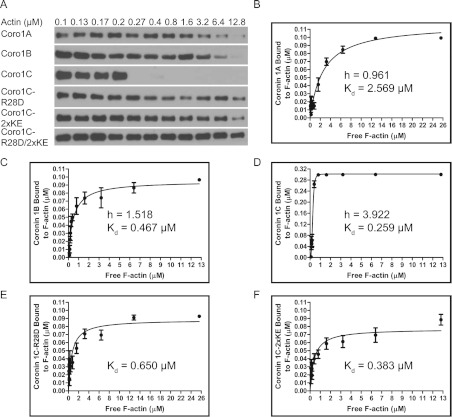
Figure 3. Coro1C binds F-actin co-operatively and with high affinity.
(A) Coro1A, Coro1B, Coro1C–R28D, Coro1C–2×KE, Coro1C–R28D/2×KE (0.1 μM) or Coro1C (0.3 μM) was incubated with increasing concentrations of actin and cosedimentation assays were performed. Supernatant fractions were separated by SDS/PAGE and analysed by immunoblotting with an anti-His antibody. Representative immunoblots are from at least four independent experiments. Quantification of the amount of Coro1A (B), Coro1B (C), Coro1C (D), Coro1C–R28D (E) and Coro1C–2×KE (F) bound to F-actin as a function of the free F-actin concentration. Each data point is shown as mean±S.E.M. from at least four independent experiments. Binding curves were fitted to the experimental data and used to generate a Hill coefficient (h) and dissociation constant (Kd), which are displayed on the plots.

