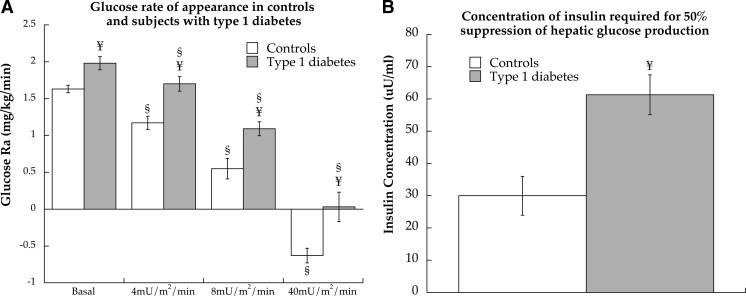
Fig. 3.
Glucose Ra (A) during basal and hyperinsulinemic/euglycemic clamp at 4, 8, and 40 mU/m2 · min insulin doses in control subjects and individuals with type 1 diabetes. The concentration of insulin required for IC50 of hepatic glucose production in both groups (B). Values are means ± sem. §, Significantly different from basal (P < 0.05); ¥, significantly different from control (P < 0.05).

