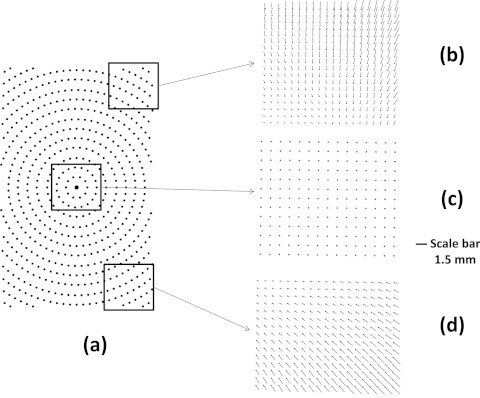
Figure 6.
Calibration results using a 96-well reference plate. (a) The location of the reference circles (b)–(d) shows the difference between measured and reference center location, represented as the length of the arrow. (c) The difference in the center region. (b) and (d) Results for upper and lower corners.

