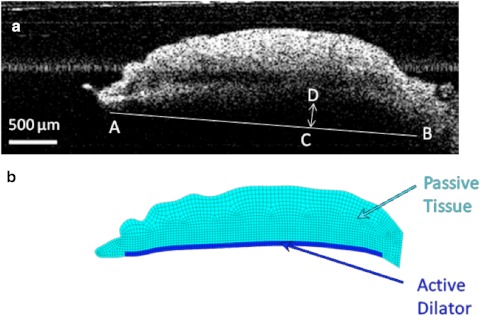
Figure 3.
(a) OCT image of the iris before the dilator is activated. Iris chord length (A–B) is defined as the distance from the tip of the iris to the periphery; iris curvature (C–D) is defined as the longest distance between the iris chord and posterior epithelium. (b) Finite element model based on the OCT image of the iris before dilation. The region modeled as the active dilator muscle is marked with the darker color.

