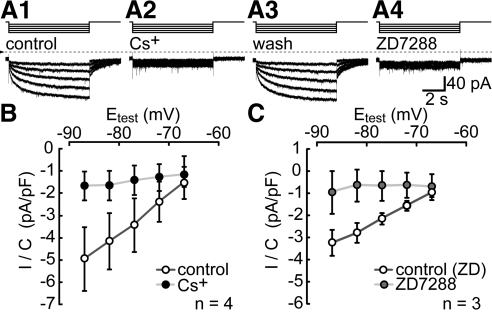
Figure 1.
Ih in cells immunopanned by anti-Thy1 antibody. Ih activated in a single cell by hyperpolarizations from the holding potential (−62 mV) to −67, −72, −77, −82, and −87 mV, while the superfusate was changed from control (A1), to 3 mM Cs+ (A2), to control solution again (A3), and then to 100 μM ZD7288 (A4). Steps above the current traces show stimulus timing. The duration of each test hyperpolarization was 7 seconds. The dotted line shows the zero-current level. Records are displayed without leak subtraction. (B) and (C) show the current density (pA/pF) of the tail currents. These were isolated by digitally subtracting the current in Cs+ or ZD7288 from the control current, measuring the current amplitude at the holding potential at 50 msec after repolarizing from each of the test potentials (Etest), and dividing by the whole-cell capacitance. Dots plot the mean of values measured in control solution (white), Cs+ (black), and ZD7288 (gray). Error bars, ± 1 SEM. n = 3 in (B); n = 4 in (C).

