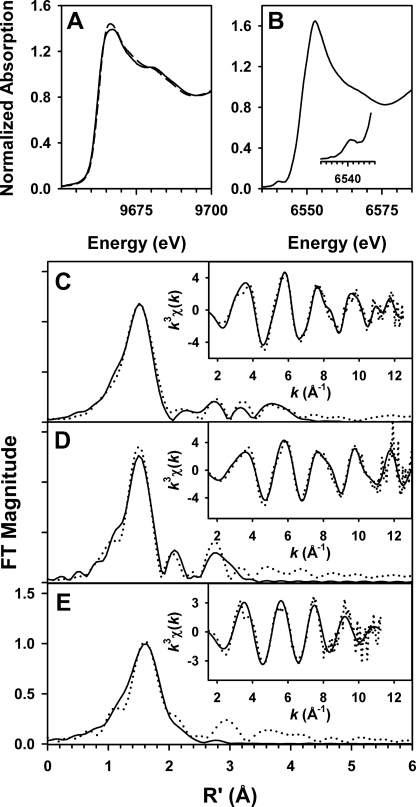
FIGURE 5.
XAS of DNPEP. A, x-ray absorption edge spectra at the zinc K-edge for both ZnZn-DNPEP and manganese-activated DNPEP. The spectra are quite similar to one another, with edge inflections at ∼9662.5 eV. B, x-ray absorption edge spectrum at the manganese K-edge for manganese-activated DNPEP. A weak pre-edge feature, magnified in the inset, is present at 6540.2 eV. C–E, Fourier transforms (FT) and unfiltered EXAFS spectra (k3χ(k), insets) of ZnZn-DNPEP at the zinc K-edge (C), manganese-activated DNPEP at the zinc K-edge (D), and manganese-activated DNPEP at the manganese K-edge (E) are shown. Experimental data are shown by dotted lines and fits by solid lines. The fit parameters correspond to those shown in boldface in Table 4.

