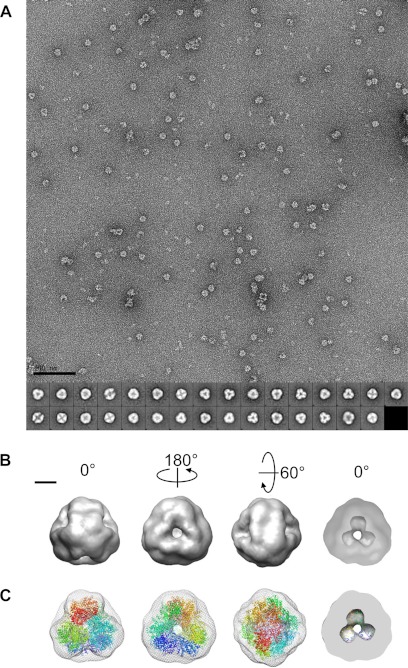
FIGURE 6.
Single particle reconstruction of DNPEP. A, micrograph of DNPEP (40 μg/ml) coated with 1% uranyl acetate at ×67,834 magnification. Aggregated and incomplete particles were omitted from the particle set. The scale bar on the bottom left indicates 100 nm. The 31 class averages derived from 5000 particles using EMAN2 are shown at the bottom of the image. B, 22-Å resolution map shown in different orientations. The cut-through section in the rightmost panel shows the hollow core of the particle with cavities extending toward the vertices of the tetrahedron. The scale bar on the top left indicates 50 Å. C, alignment of the EM map (mesh) with the crystallographic model of the DNPEP tetrahedral dodecamer (ribbons colored differently for each monomer) with the same orientations shown in B. Figures were prepared using Chimera.

