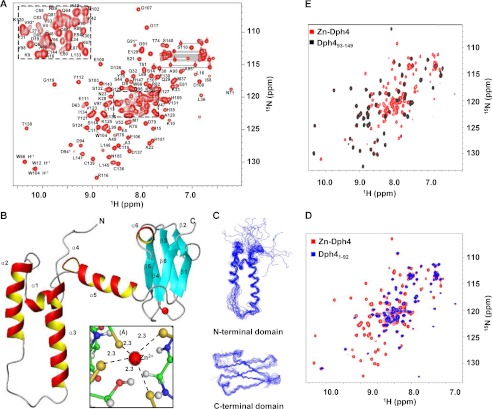
FIGURE 4.
Structural analysis of full-length Zn-Dph4. A, two-dimensional 15N-1H HSQC spectrum of Zn-Dph4 acquired at 1H resonance frequency of 700 MHz at 298 K. Sequence-specific resonance assignments are indicated by labels depicting the single-letter code for the amino acid followed by the residue number. Side chain amide signals of asparagines and glutamines are shown connected by horizontal lines. Peaks from residues undergoing conformational exchange are marked by asterisks. The overlapped region of the spectrum is expanded in the inset. B, ribbon diagram of representative structure of Zn-Dph4, Zn2+ (red) in tetrahedral coordination with Sγ (gold) (inset). The average Zn–Sγ distance is marked with dotted lines. C, superimposition of the 20 best structures of N-terminal J-domain (top) and C-terminal CSL-domain (bottom). D, overlay of two-dimensional 15N-1H HSQC spectrum of full-length Zn-Dph4 and Dph4(1–92). E, overlay of two-dimensional 15N-1H HSQC spectrum of Zn-Dph4 and Dph4(93–149).

