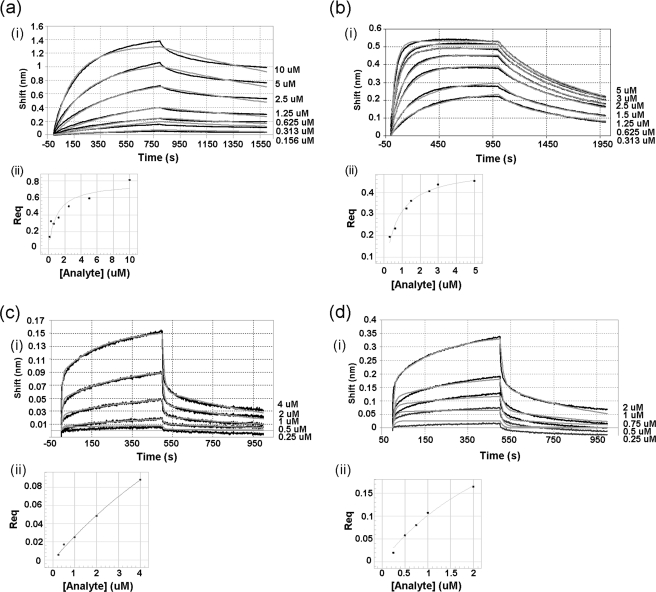
FIGURE 5.
Kinetics of the interaction between immobilized H-N-cJun and JNK1β1: comparison of the effects of ATP and JNK1β1 phosphorylation state on the interaction. (i) experimental data for association and dissociation are represented by black lines and nonlinear least squares fitting by gray lines. Concentrations of analyte are indicated on the right side of each binding curve. (ii) secondary plots: response at equilibrium against analyte concentration for steady-state analysis of the data to determine equilibrium dissociation constants. a, inactive (unphosphorylated) JNK1β1 and H-N-cJun interaction. Steady-state KD was 1.00 ± 0.35 μm. b, inactive (unphosphorylated) JNK1β1 and H-N-cJun interaction in the presence of 200 μm ATP-Mg2+. KD value obtained from steady-state analysis was 0.65 ± 0.07 μm. c, active (phosphorylated) JNK1β1 and H-N-cJun interaction. KD was 17.0 ± 7.5 μm, and d, active (phosphorylated) JNK1β1 and H-N-cJun interaction in the presence of 200 μm ATP-Mg2+. KD = 3.5 ± 0.95 μm.

