FIGURE 3.
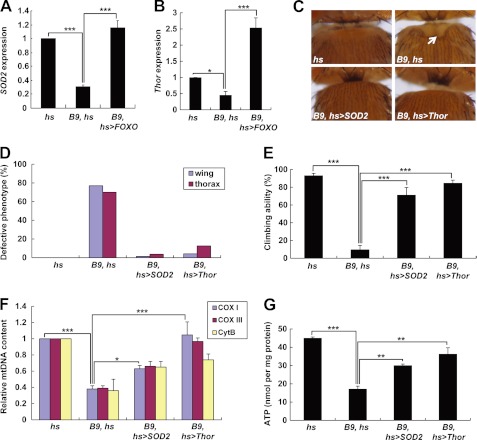
FOXO target genes SOD2 and Thor rescue PINK1 null mutant phenotypes. A, comparison of SOD2 mRNA level in the thoraces from wild type controls (hs), PINK1 null mutants (B9, hs), and FOXO-expressing PINK1 null mutants (B9, hs>FOXO) (n = 3). B, comparison of Thor mRNA level in the thoraces (n = 3). C, light stereo micrographs of the thoraces of wild type controls (hs), PINK1 null mutants (B9, hs), SOD2-expressing PINK1 null mutants (B9, hs>SOD2), and Thor-expressing PINK1 null mutants (B9, hs>Thor). A white arrow indicates collapsed-thorax phenotypes. D, percentage of defective thorax and wing phenotypes. E, comparison of climbing ability (n = 4). F, quantification of the mtDNA of thoraces (n = 3). Cox I, cytochrome c oxidase subunit I; Cox III, cytochrome c oxidase subunit III; Cyt B, cytochrome b. G, comparison of the ATP content of thoraces (n = 3). Significance was determined by one-way ANOVA with Bonferroni's correction (*, p < 0.05; **, p < 0.01; ***, p < 0.001). Error bars indicate mean ± S.D.

