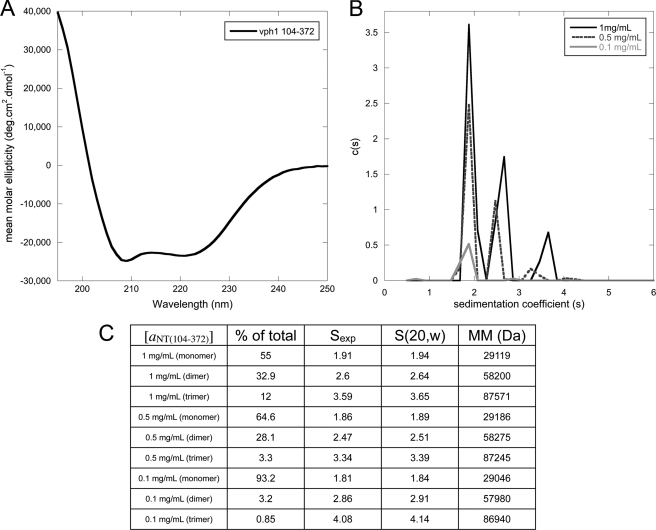
FIGURE 2.
Circular dichroism spectroscopy and analytical ultracentrifugation of aNT(104–372). A, far UV circular dichroism spectrum of aNT(104–372). The spectrum indicates that the protein is folded, with the characteristic minima at 208 and 222 nm indicating α helix. B, sedimentation velocity analytical ultracentrifugation experiments were used to examine the concentration dependence of aNT(104–372) dimerization. The c(s) distribution is shown for the construct at three protein concentrations (3.2 μm, 16 μm, and 32 μm). A clear concentration dependence on the oligomeric state can be seen, with an ∼93% monomer at 3.2 μm and an ∼55% dimer at 32 μm. As the samples were all concentrated and then diluted for analytical ultracentrifugation experiments, the concentration-dependent oligomerization is reversible. C, table of data for each peak in the overlaid c(s) distribution in B. The molecular mass and s (20, w) values of each species were calculated using the SEDNTERP and SEDFIT software.

