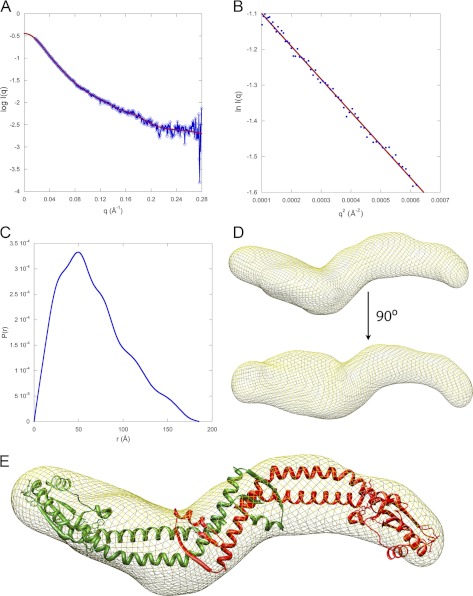
FIGURE 3.
SAXS analysis of aNT(104–372). A, small angle x-ray scattering curve of aNT(104–372). The data is plotted as the log of the scattering intensity as a function of momentum transfer, q (q = 4πsin(θ)/λ, where 2θ is the scattering angle and λ is the x-ray wavelength, 1.2524 Å). The fit to the scattering data, calculated using GNOM software, can be seen in the plot. B, Guinier plot of the data showing a linear fit (qRg = 1.3, where Rg is the radius of gyration of the particle). C, plot of the distance distribution function, P(r). The shape of the P(r) plot indicates an elongated protein with a maximum intraparticle distance of 185 Å. D, SAXS model of aNT(104–372). Twenty individual models were calculated using the DAMMIF program and averaged using DAMAVER. The final filtered model represented by a mesh was generated using SITUS. Fitting of the INT x-ray structure (minus the equivalent residues not present in aNT(104–372)) was done in CHIMERA. The SAXS model shows that the protein has a curved, elongated shape. The molecular mass of the protein was calculated from the SAXS data using glucose isomerase and lysozyme as standards and was found to be 67 kDa, indicating a dimer (predicted mass of the dimer is 63 kDa). The nature of the protrusion seen in the lower part of D is unknown but may be due to presence of a trimeric species in fast exchange with the likely dominant dimeric population at the concentration used for SAXS analysis.

