FIGURE 2.
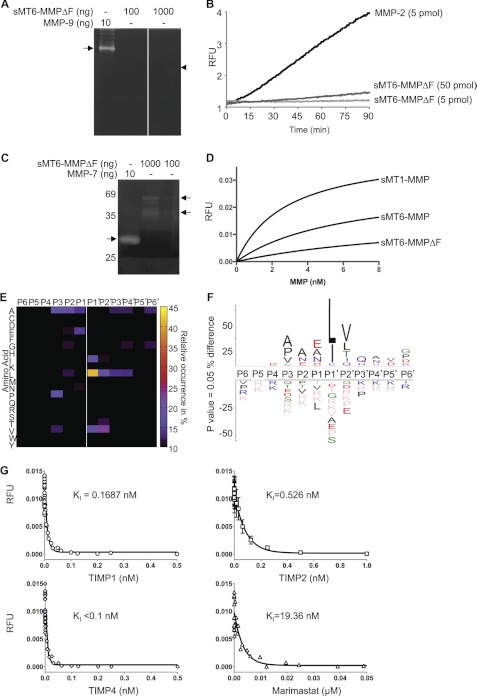
Characterization of MT6-MMP protein. A, gelatinase activity of sMT6-MMPΔF was evaluated by gelatin zymography. 10 ng of MMP-9 resulted in a clear band (arrow), whereas 100 and 1,000 ng of sMT6-MMPΔF resulted in only a slight clearance (arrowhead), indicating weak gelatinolytic activity (n = 2). B, quenched fluorescein-conjugated gelatin processing by sMT6-MMPΔF compared with MMP-2 processing was monitored at an excitation/emission of 485/530 nm (n = 2). C, casein processing by sMT6-MMPΔF was evaluated by zymography. 10 ng of MMP-7 resulted in a clear band (arrow), whereas 100 and 1,000 ng of sMT6-MMPΔF resulted in only a slight clearance (arrowhead), indicating that casein is not a good substrate for MT6-MMP (n = 2). D, the rate of cleavage of QF24 substrate by increasing concentrations of MMPs was compared by measurement of the increase in fluorescence at an excitation/emission of 320/405 nm (n = 2). E, heat map of the amino acid occurrence at positions P6 to P6′ of the 286 peptides analyzed and identified by MS/MS following PICS analysis of sMT6-MMPΔF cleavage of a tryptic library. F, IceLogo analysis of the PICS data, adjusting for relative abundance of the amino acids in the Homo sapiens proteome, indicating the relative occurrence of amino acids at positions P6 to P6′ from the 286 peptides analyzed and identified. G, inhibition of 3 nm sMT6-MMPΔF processing of 1.0 μm QF24 by TIMP1, -2, and -4 and by marimastat was evaluated by measurement of fluorescence at an excitation/emission of 320/405 nm, and the Ki was calculated in Prism (GraphPad) (n = 3). RFU, relative fluorescent units.

