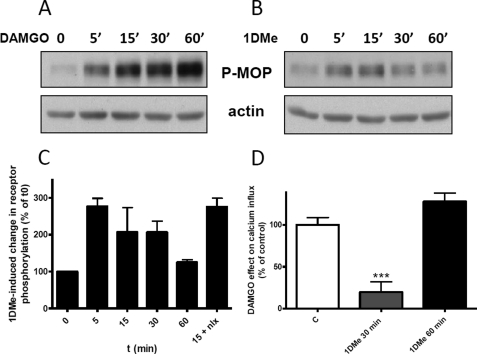
FIGURE 2.
Correlation between the kinetics of heterologous phosphorylation of MOP receptor Ser-377 and desensitization of MOP receptor signaling. Representative Western blots showing the levels of Ser-377 phosphorylation induced by treatment with 1 μm DAMGO (A) or 1 μm 1DMe (B) for the indicated time at room temperature. Samples were immunoblotted with anti-Ser(P)-377 antibody followed by anti-actin antibody for normalization. Upper panels show representative results from at least three independent experiments. C shows the quantification of Ser-377 phosphorylation induced by 1DMe, normalized to actin. Data are expressed as means ± S.E. of three independent experiments performed with 1DMe. The 15 + nlx bar corresponds to a 15-min treatment with 1DMe together with 10 μm naloxone (nlx). D, inhibition of potassium-evoked calcium influx by 30 s of treatment with 0.1 μm DAMGO in control cells (c) or in cells pretreated with 1 μm 1DMe for 30 or 60 min. Results are expressed as % of the DAMGO effect (46.5% inhibition) in control cells (c). Intracellular calcium was measured using Fluo-4. ***, p < 0.001; one-way ANOVA followed by Bonferroni post tests. Number of cells: 48 (C), 47 (1DMe 30 min), and 25 (1DMe 60 min).

