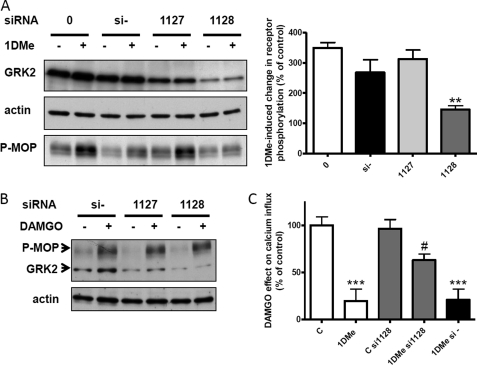
FIGURE 3.
Effect of GRK2 knockdown on MOP receptor phosphorylation and desensitization. A, heterologous phosphorylation. Left panel, representative Western blots showing the levels of GRK2, actin, and MOP receptor Ser-377 phosphorylation (P-MOP) in cells transfected with transfection agent alone (0), negative control siRNA (si−), or GRK2 siRNAs (1127 and 1128) and treated or not with 1 μm 1DMe for 30 min. Right panel, histogram showing the quantification of Ser-377 phosphorylation induced by 1 μm 1DMe in cells transfected with transfection agent alone (0), negative control siRNA (si−), or GRK2 siRNAs (1127 and 1128). Data are expressed as percent of stimulation over nonstimulated cells (means ± S.E. of three independent experiments). **, p < 0.01; one-way ANOVA followed by Bonferroni post-tests. B, homologous phosphorylation. Representative Western blot showing the levels of GRK2, actin, and MOP receptor Ser-377 phosphorylation (P-MOP) in cells transfected with negative control siRNA (si−) or GRK2 siRNAs (1127 and 1128) and treated or not with 1 μm DAMGO for 30 min. C, heterologous desensitization. Inhibition of potassium-evoked calcium influx by 30 s of treatment with 0.1 μm DAMGO and effect of pretreatment with 1 μm 1DMe for 30 min in control cells and cells transfected with control (si−) or GRK2 (si1128) siRNAs. Results are expressed as percent of the DAMGO effect in control cells (c). Intracellular calcium was measured using Fluo-4. ***, p < 0.001 versus control (c); #, p < 0.05 versus 1DMe; one-way ANOVA followed by Bonferroni post-tests. Number of cells: 48 (c), 47 (1DMe), 60 (C si1128), 58 (1DMe si1128), and 41 (1DMe si−).

