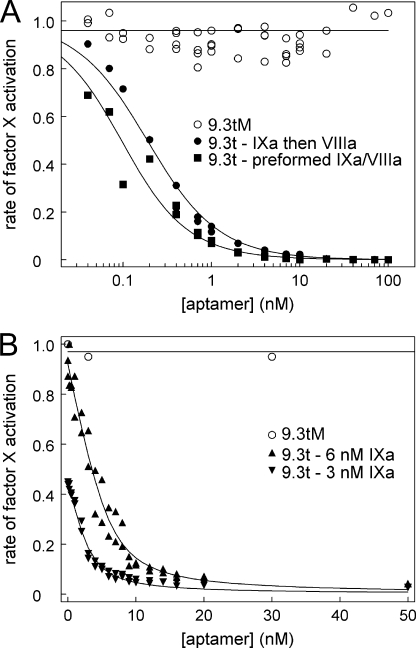
FIGURE 4.
Aptamer blocks factor IXa activation of factor X with or without factor VIIIa. A, the indicated concentrations of aptamer 9.3t were incubated with factor IXa (●) or preformed factor IXa-factor VIIIa complex (■), and factor X activation was measured. Mutant aptamer 9.3tM data for both data sets are shown (○). Factor Xa generation is expressed relative to the initial rate in the absence of the aptamer. The data for the aptamer incubated with factor IXa were fit to the quadratic equation (Equation 9) described under “Experimental Procedures” and gave a value of 0.16 ± 0.01 nm. The data fit for the aptamer added to the factor IXa-factor VIIIa complex gave a value of 0.07 ± 0.01 nm. B, the indicated concentrations of aptamer 9.3t were incubated with 6 nm (▴) and 3 nm (▾) factor IXa, and factor X activation on lipid vesicles was measured. Mutant aptamer 9.3tM data for 6 nm factor IXa are shown (○). The data for the aptamer incubated with factor IXa were fit to the quadratic equation (Equation 9) described under “Experimental Procedures” and gave a value of 0.9 nm (0.84 ± 0.06 and 0.93 ± 0.12 nm for 3 and 6 nm factor IXa, respectively).

