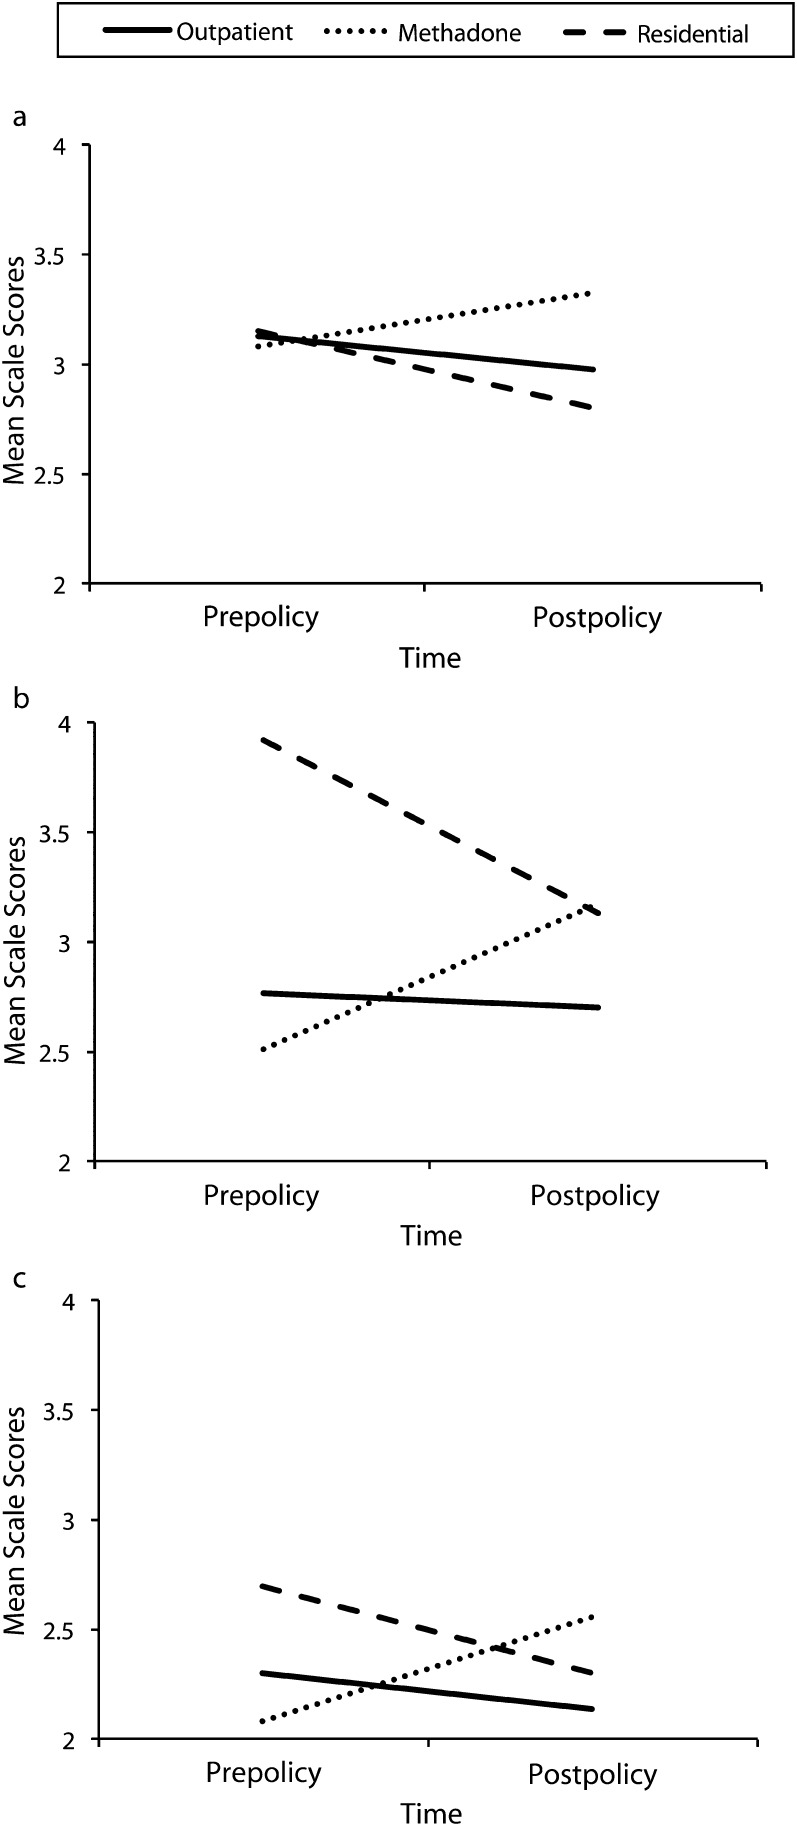
FIGURE 2—
Interactions of time by treatment type for (a) attitudes, (b) program services, and (c) clinician services on the client survey scales: addiction treatment programs, New York State, 2008–2009.
Note. Outpatient time effects shown in the figure were not significant for any of the measures shown. Residential time effects were significant for attitudes (P < .001), program services (P < .001), and clinician services (P < .001). Methadone time effects were significant for attitudes and program services at P < .05, and were not significant for clinician services (P = .21). Scale scores ranged from 1 to 5.

