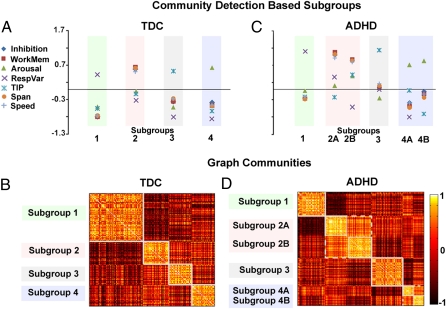
Fig. 4.
Community detection identified subgroups. (A) After applying the community detection procedure to the typically developing cohort, four unique subgroups (i.e., cognitive profiles) emerge (y axis = z score). The community structure is depicted by correlation matrices shown in B. These correlation matrices represent a 213 × 213 matrix (for TDC) and 285 × 285 matrix (for ADHD). On the grid, darker colors reveal lower or negative correlations between subjects, and lighter colors reveal positive correlations between subjects. Identified communities are outlined in white. (C) Independently applying the community detection algorithm to the ADHD cohort shows similar findings to those in A. The difference between the two appears to be split in subgroup 2 and subgroup 4. The correlation matrices of the ADHD cohort are presented in D.

