Fig. 2.
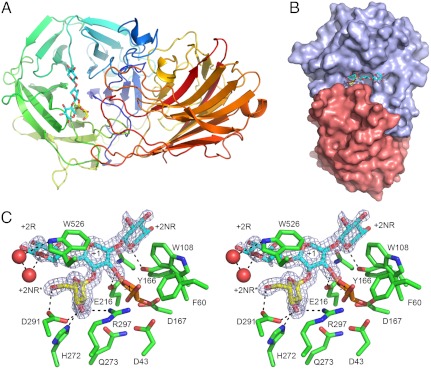
Structure of HiAXHd3. (A) The overall structure of HiAXHd3 in complex with Araf-Xylp3. The protein is shown as a cartoon, color-ramped from the N terminus (blue) to C terminus (red); the sugar is displayed as sticks, with xylose units depicted in cyan and arabinose in yellow. (B) The solvent accessible surface of HiAXHd3 in complex with Araf-Xylp3. The β-propeller domain is colored slate and the β-sandwich in salmon. (C) Wall-eyed stereo view of the active site, showing protein residues and the sugar as sticks with the maximum likelihood/σa-weighted 2mFobs-DFcalc electron density map for the carbohydrate shown in blue and contoured at 1σ (0.54 e-/Å3). The experimental model for the Araf-Xylp3 is shown in yellow and blue for the arabinose and xylose, respectively; arabinose has been modeled into the -1 subsite based on the positions of crystallographic waters and is shown in orange. The dotted lines show polar interactions between the ligand and the protein. This figure, and other structure figures, were drawn with PyMol (DeLano Scientific; http://pymol.sourceforge.net/).

