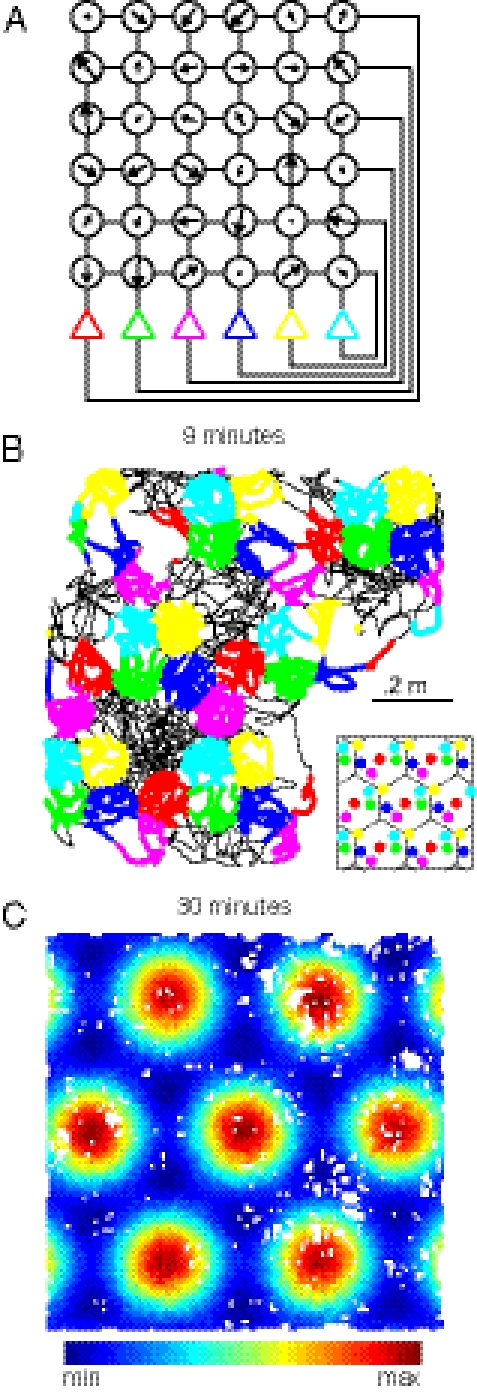
Fig. 2.
A six-unit grid cell network. (A) Weights were found for a network with randomly chosen spatial phases. This network is shown using the same convention as in Fig. 1B. (B) Simulated trajectory over 9 min is shown (black line). To display activity, spikes are plotted as colored dots whenever a unit’s activity crosses 75% of its maximum. If multiple units simultaneously cross the threshold, only the unit with highest activity is displayed. Color scheme is same as in A. Inset shows the spatial phases for each unit on top of the underlying hexagonal tiles. (C) For a full 30-min session, the average unit activity at each position (100 × 100 bins) for the first neuron (previously in red) is shown. White indicates positions not visited in the simulation. See SI Text 7 for further details.

