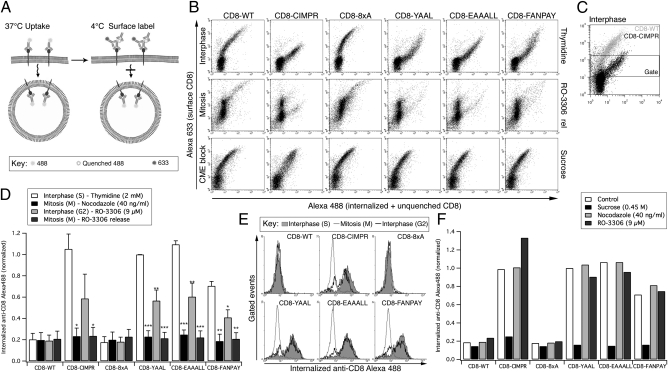
Fig. 1.
Internalization of CD8 chimeras is strongly inhibited in mitosis. (A) Schematic representation of flow-cytometry based antibody uptake assay (28). (B) Representative flow cytometry plots of internalized (anti–CD8-Alexa488, x axis) versus surface CD8 (anti–Alexa488-Alexa633, y axis). Examples are shown from cells in interphase (S phase, 2 mM thymidine), mitosis (9 μM RO-3306, 30-min release), or interphase with inhibition of CME (S phase + 0.45 M sucrose). Note that there are fewer mitotic cells with very low surface amounts of CD8, but that these lie outside the gate. (C) Illustration of the gating procedure to analyze cells expressing moderate levels of CD8 at the cell surface. (D) Quantification of flow cytometry experiments. Signals were gated to analyze the internalization in cells expressing moderate amounts of CD8 at the cell surface. The geometric mean amount of internalized anti–CD8-Alexa488 was normalized to thymidine-treated CD8-YAAL uptake. Mean ± SEM of three independent experiments plotted as a bar graph. *P < 0.05, **P < 0.01, and ***P < 0.001. (E) Antibody uptake profiles for interphase (2 mM thymidine), G2/M border (9 μM RO-3306 with no release) and mitosis (9 μM RO-3306, 30-min release). Gated events are shown as overlaid histograms of internalized anti–CD8-Alexa488 fluorescence (x axis) against the number of events (y axis). (F) Bar chart to summarize a typical antibody uptake experiment to test for direct effects of nocodazole and RO-3306 on CME. Cells were released from a thymidine block and the anti–CD8-Alexa488 uptake assay performed in the presence of nocodazole, RO-3306 or sucrose.

