Fig. 4.
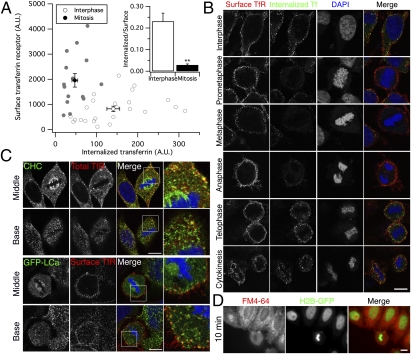
Transferrin uptake is inhibited during early mitosis despite abundant surface TfR. (A) Quantification of transferrin uptake and surface TfR from whole-cell confocal images. A plot of values from 24 interphase cells (white) and 15 cells in early mitosis (gray), mean ± SEM for all cells is indicated. Inset shows the mean ± SEM ratio of transferrin uptake to surface TfR. (B) Representative confocal images of HeLa cells after 7-min uptake of Alexa488-conjugated transferrin at 37 °C. Cells were acid-washed to remove surface-bound transferrin, fixed, and stained by using anti-TfR antibody. Images of cells at different stages of mitosis are shown. Note the recovery of internalization that begins in anaphase. 3D reconstructions of Z-series confocal images are shown in Fig. S3. (C) Representative confocal images to show colocalization of clathrin and TfR in the middle or base of a mitotic cell. Clathrin is detected by staining with anti-clathrin heavy chain (CHC; Upper) or by expression of GFP-tagged clathrin light chain a (GFP-LCa; Lower). Total TfR or TfR at the surface in nonpermeabilized cells are as indicated. Threefold zoomed panels are shown (Right). (D) Representative fluorescence micrograph from experiments to examine uptake of FM4-64-labeled plasma membrane in HeLa cells. H2B-GFP expressing HeLa cells were incubated with FM4-64 for 10 min and live-cell imaging performed as described (Materials and Methods). (Scale bars: 10 μm.)

