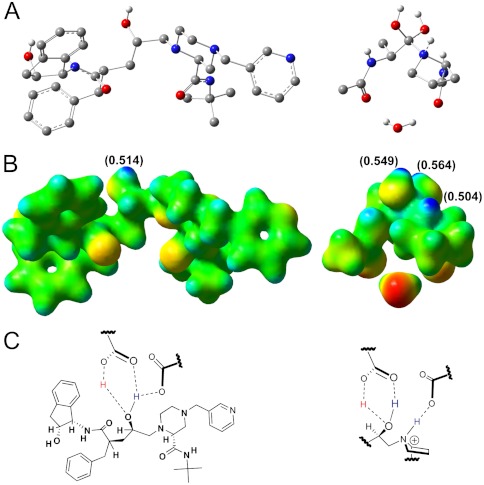
Fig. 5.
Electrostatic potential, NBO charges, and inhibitor scaffolds. (A) Structure of the clinical inhibitor indinavir bound to the HIV-1 protease active site obtained from the PDB structure 2AVO (Left) and the proton transfer transition structure 13 (Right). (B) Electrostatic potential maps (blue = partial positive, red = partial negative) extrapolated from single-point energy calculations (M06-2X/6-31+G**) of indinavir (Left) and 13 (Right). NBO charges are indicated in parentheses. (C) Structural interactions with the catalytic aspartates and indinavir (Left) and a potential proton transfer TS scaffold (Right).

